

Kaspa (KAS) is entering the week with renewed momentum following the recent Kasplex upgrade, which introduced full smart contract support on December 4. This development triggered a significant 19% rebound in the KAS price, drawing attention back to the cryptocurrency after a challenging month. The positive sentiment was further bolstered by Coinbase Derivatives launching KAS perpetual futures, providing traders with round-the-clock access and injecting fresh liquidity into the market. Additionally, the Kaspa ecosystem has seen expansion across multiple chains, creating more avenues for KAS utilization and movement. These developments are carrying into the current week, positioning the KAS chart at a critical juncture.
KAS Chart Analysis
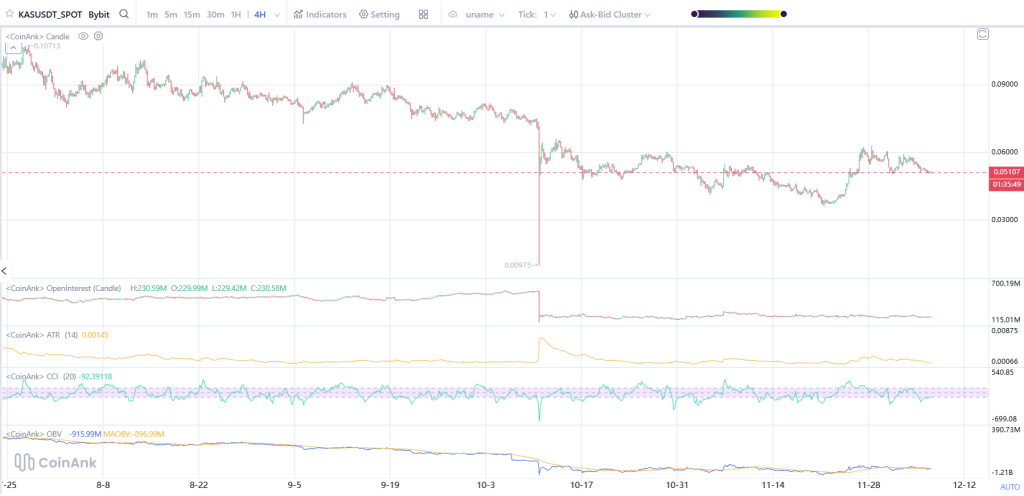
The Kaspa price has been on a downward trend since early August, having fallen from its peak near $0.107. Despite attempts to break this trend, each has ultimately failed, with consolidation periods on the chart not evolving into substantial reversals. A notable event was the sharp decline in early October, which saw KAS briefly dip towards $0.0097 before recovering. While this liquidation spike temporarily established a bottom, the subsequent recovery stalled around the $0.06 mark before fading once again. Currently, the KAS price is trading around $0.051, with price action moving sideways after a minor bounce. The chart pattern consistently displays lower highs, indicating a lack of significant buying strength. Even recent rallies have been unable to reclaim the breakdown levels from mid-November, suggesting the broader pattern remains a controlled descent without a clear breakout structure forming.
Market Indicators
Open interest has seen a sharp decline since the October flush and has remained relatively flat, signaling a lack of new leveraged positions being opened by traders. This typically suggests that significant trend movements are less likely until fresh open interest enters the market. The ATR (Average True Range) is also at low levels, confirming a compression in volatility. While low volatility can often precede larger moves, the direction remains uncertain. The CCI (Commodity Channel Index) touched oversold levels before experiencing a bounce, which accounts for the short-term recovery. However, the indicator remains below the neutral line, indicating a prevailing bearish trend. The OBV (On-Balance Volume) has been in a steady decline since August, reflecting sustained distribution. Despite price rebounds, the volume has not been sufficient to support a full reversal. Funding rates are near neutral, implying that futures traders do not exhibit a strong directional bias.
Short-Term Outlook for Kaspa Price This Week
A breach of the $0.049–$0.050 support zone for KAS could lead to a retest of the October lows near $0.0097, although such a significant drop would likely be contingent on a broader market downturn. Realistically, the more immediate downside target is around $0.045, where previous liquidity was built up. On the upside, the KAS price must reclaim the $0.060 level to demonstrate buyer control. This level has acted as resistance multiple times and serves as the critical demarcation between the current consolidation and a potential reversal. A sustained close above $0.060 could propel momentum towards $0.067 this week.
Despite the current technical consolidation, Kaspa's fundamentals appear robust. The addition of smart contract capabilities, increased futures market access, and ongoing integrations contribute positively to its long-term growth prospects. However, until there is a noticeable increase in volume and open interest, the short-term outlook remains cautious. This week's price action will likely depend on whether the KAS price can hold the $0.050 support zone long enough for buyers to re-enter the market.