

The Kaspa (KAS) price is entering the new week following one of its most significant runs in months. The token experienced a surge of over 40%, attributed to the launch of its first decentralized bridge and its approval as a base asset on Dymension.
This development has provided Kaspa with new cross-chain utility and attracted considerable attention from traders seeking fast-moving assets. Aggressive buying from whales further contributed to KAS climbing 45% in a week, coinciding with renewed discussions around the upcoming DAGKnight upgrade.
The KAS price is currently trading near a key psychological support level, setting the stage for either continued upward momentum or a potential cooldown period.
Kaspa Chart Analysis
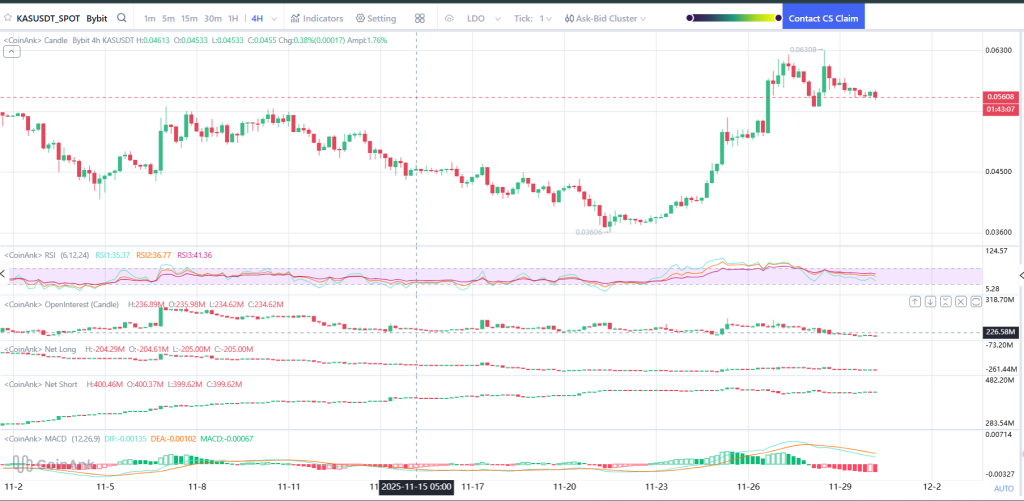
A closer examination of the 4-hour chart reveals the recent price action in more detail. Until late November, the Kaspa price had largely moved sideways, fluctuating between $0.036 and $0.046. Following this period, the token entered a deeper pullback phase.
After reaching a low near $0.036, the KAS chart experienced a sharp reversal, leading to a breakout that propelled the price into the $0.063 zone. This entire rally was characterized by strong bullish candles, increasing volume, and minimal resistance until the upward momentum eventually stalled.
Recent price action indicates the Kaspa price is cooling off around $0.056 after reaching a high of $0.063. The sharp, vertical move has left a structural gap that the market may seek to retrace.
Buyers have repeatedly intervened around the $0.055 mark, establishing this area as the first line of defense. While the chart still maintains a higher-low formation, the upward momentum has noticeably slowed in the last two trading sessions.
If the KAS price remains above $0.053, the bullish structure will likely be preserved, potentially leading to another attempt towards the $0.062–$0.064 range. Conversely, if the market falls below $0.053, the price could revisit the $0.048 liquidity zone, which previously acted as a strong reaction area before the breakout. The next significant support level is located further down at $0.046, the price point that capped Kaspa's movement for most of the preceding range.
Market Indicators
Relative Strength Index (RSI): The RSI peaked above 70 during the breakout but has since settled around 36–41. This indicates that the market has reset from overbought conditions but has not yet regained strong bullish momentum. A move back above 50 would signal a resurgence of buyer interest.
Open Interest: Open interest has shown a clear decline following the breakout, dropping from 236 million to approximately 226 million. This typically suggests that leveraged traders have begun closing positions after the initial surge, aligning with the current consolidation phase observed on the chart. Sustained upward movement will likely require fresh open interest expansion.
Long and Short Data: The long and short positions are relatively balanced. Net longs indicate slight profit-taking activity, while net shorts remain steady. Neither side is currently dominating the market, which is consistent with the consolidation behavior in the price candles. A significant unwinding of net short positions could trigger a rapid jump in Kaspa's price.
Moving Average Convergence Divergence (MACD): The MACD suggests that the rally is losing steam. The histogram is fading, and the signal lines are nearing a downward cross. While this does not confirm a trend reversal, it indicates a cooling of momentum. A fresh bullish cross would support the possibility of another breakout attempt.
KAS Price Short-Term Outlook for This Week
The short-term direction of Kaspa's price will largely depend on its performance around the $0.053 and $0.062 levels. Maintaining support above $0.053 would preserve the bullish structure, especially given the continued interest from whales and the new attention generated by the Dymension bridge.
A decisive push above $0.062 could open the path towards the $0.070–$0.074 range, aligning with upside targets previously identified by analysts following the exponential moving average (EMA) flip.
If the Kaspa price fails to hold $0.053, the market is likely to experience a deeper cooldown. The $0.048 liquidity zone would become the initial target, followed by $0.046 if selling pressure accelerates. Such a scenario would serve as a reset for the chart after an exceptionally strong run, rather than invalidating the broader bullish trend.
Currently, Kaspa appears to be taking a breather after a significant breakout. The RSI has reset, open interest has cooled, and the price has found support at a critical juncture following a parabolic move.
With the successful launch of the bridge, integration with Dymension, and anticipation surrounding the DAGKnight upgrade, the fundamental drivers for continued momentum remain in place. The key question for the upcoming week is whether the market will attempt another push higher immediately or after a brief consolidation.