

Chainlink has experienced a slight cooldown following its significant upward movement in late October, but its overall market position remains robust.
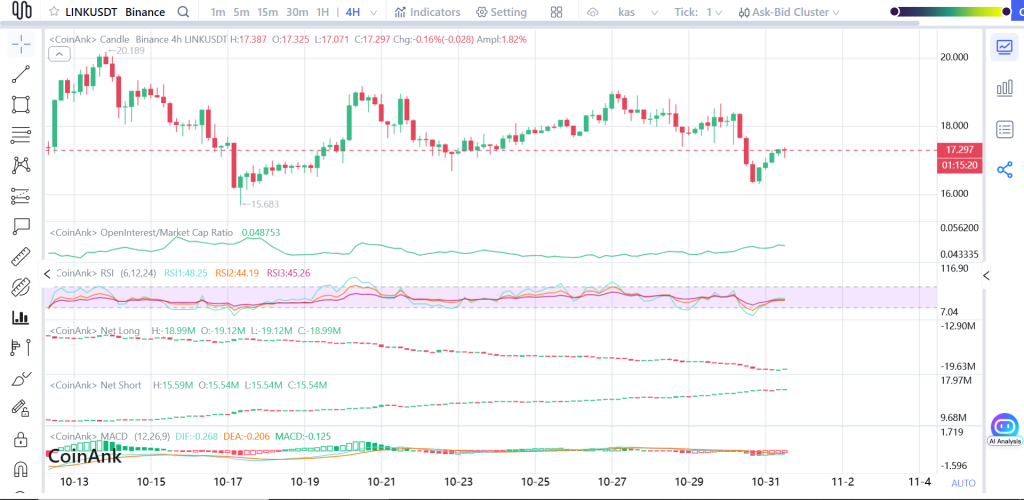
On the 4-hour chart, LINK price is currently trading around $17.30. The asset saw a brief dip followed by a swift recovery, with buyers actively stepping in near the mid-$16 area. Meanwhile, sellers have consistently prevented any strong upward push into the high $17s. This price range represents a key battleground as the market heads into November.
What the LINK Chart Is Telling Us
Despite the recent pullback, LINK continues to exhibit a bullish structure. The bounce observed from approximately $16.50 to $16.80 has established a higher low, a positive indicator for the continuation of the current trend. The critical question now is whether LINK can successfully break above the resistance zone between $17.90 and $18.20.
This particular price level has acted as a barrier, thwarting the last two attempts to drive the price higher. A decisive break above this resistance could potentially lead to a move towards $18.80 and possibly extend to $19.50.
Conversely, if the LINK price retreats below $16.80, it is likely to slide back into the $16.00–$16.20 zone to retest support levels.
Indicators: Not Bullish Yet, But Showing Promise
The current momentum indicators suggest a neutral market sentiment. The Relative Strength Index (RSI) is positioned around the mid-40s, typically indicating a period of consolidation rather than a strong directional trend. The Moving Average Convergence Divergence (MACD) indicator is also flat, suggesting that selling pressure is not accelerating and the market is awaiting a catalyst for its next move.
Open interest is gradually increasing, signaling renewed trader engagement. Notably, there has been a slight rise in short positions. If resistance breaks, these short positions could potentially contribute to an upward price surge through a short squeeze.
LINK Price Outlook
The most probable scenario hinges on LINK's ability to sustain a close above $17.90. Such a move would likely attract momentum traders back into the market.
Following this, $18.20 and $18.80 would serve as the initial significant price targets. A strong daily close above $18.80 could then pave the way for a move towards the $19.50–$20.20 range.
However, if the LINK price falls below $16.80 once again, the market may need to consolidate within the $16.00–$16.20 support area, with a possibility of moving lower into the mid-$15s before initiating a rebound.
Currently, bulls are demonstrating strong defense, sellers are not exhibiting significant strength, and the market appears to be gathering energy for a more substantial move. The moment the price breaks out of its current range, November could become a significantly more active month for LINK holders.