

Zcash (ZEC) has recently experienced a period of strong performance, but this upward momentum is now facing significant pressure. After reaching a high of $310, the price has pulled back and is currently trading just below the critical $237 resistance level. According to market analyst CJ Bennett, this zone is of paramount importance. If bullish forces cannot sustain their hold on this level, the ZEC price could be poised for a more substantial pullback before any meaningful recovery can begin.
ZEC Daily Chart Indicates Cooling Momentum
Analysis of the daily timeframe for ZEC reveals a period of consolidation. The chart has confirmed a local top candle formation immediately following the rejection at the $310 mark. Since then, the price has struggled to regain footing above the $237 level. The absence of green dots, typically indicators of bullish momentum on this timeframe, suggests that short-term energy in the market has somewhat subsided.
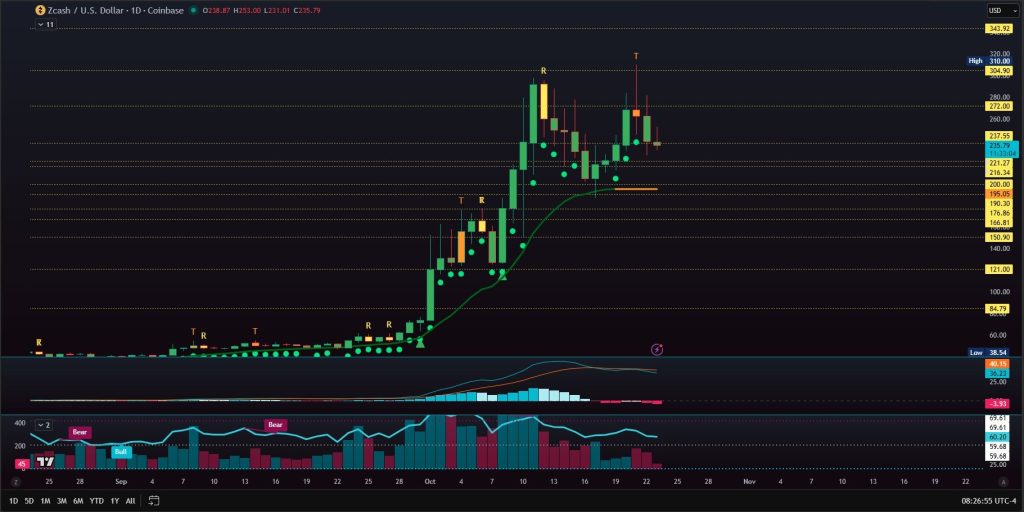
However, all bullish signals remain intact on the weekly chart, indicating that the broader, long-term trend is still positive. In summary, while the short-term price action appears uncertain, the long-term outlook for ZEC remains favorable. Should the price of ZEC fall below $221, the next significant support level is anticipated to be between $200 and $210, an area that has historically served as a strong base for price recovery.
ZEC 4-Hour Chart Shows Range-Bound Trading and Indecision
The 4-hour chart for ZEC currently depicts a period of indecision and range-bound trading. Since the rejection at $310, ZEC's price has been confined within the range of $216 to $237, indicating a lack of clear directional bias. Bennett describes this phase as "chop," characterized by short bursts of movement followed by quick pullbacks, making it difficult to establish a consistent trend.
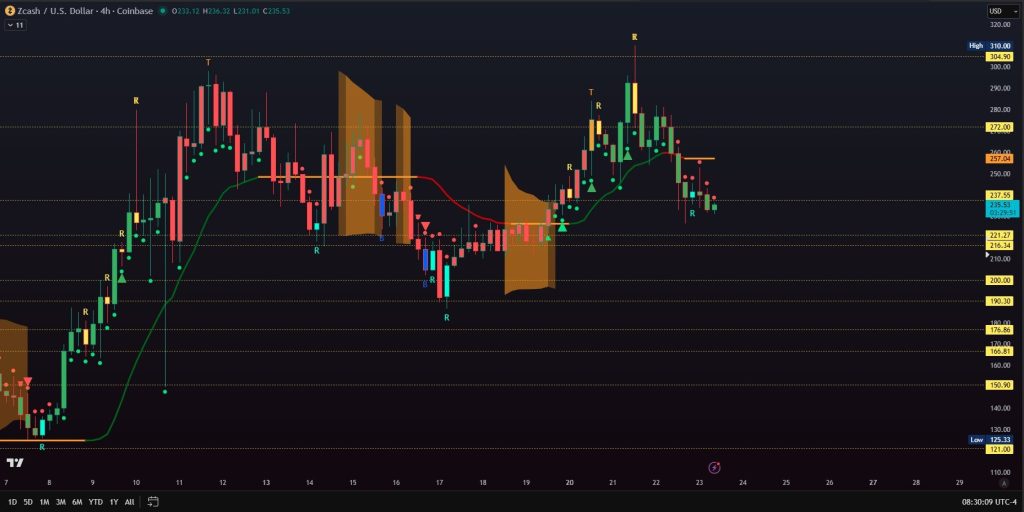
Thus far, only one minor reversal signal has appeared on this timeframe, but it has not yet been confirmed. For bullish sentiment to re-establish control, ZEC needs to successfully break through the $237-$240 resistance zone and maintain its position above it. Such a move would likely trigger a short-term reversal, potentially targeting $272 or even $304. Conversely, if bulls fail to defend the current price area, the next likely target for the price would be around $200, which corresponds to the breakout level observed in early October.
Larger Bullish Patterns Remain in Play
Despite the short-term trading volatility, Bennett points to the potential formation of several significant bullish patterns. Depending on how the price action unfolds, ZEC could be shaping up for a cup and handle pattern, a double bottom formation, or an inverse head and shoulders pattern. These chart setups are typically indicative of a substantial reversal in trend. Therefore, even if another dip occurs, as long as the support zone between $200 and $210 holds firm, the ZEC price may still be positioned for another significant upward movement.
However, if this support level breaks, the situation could become more challenging, with the price potentially declining towards $176 or $150 before finding stabilization.
Overall, Zcash still appears to be in a healthy position, but the coming days are critical. Sustaining the current support level could pave the way for a new leg higher, targeting the $272 to $310 range. A failure to hold this zone might necessitate a period of consolidation and reset before further upward attempts can be made.