
Key Takeaways
- •The model outlines four structural outcomes for XRP, ranging from a bearish breakdown to an ultra-bullish pennant breakout.
- •These scenarios are based on XRP/BTC ratios applied to projected Bitcoin price ranges.
- •Across all outcomes, the statistical mean of projections places XRP near $11.
- •The study emphasizes XRP’s asymmetric long-term potential while highlighting market structure as the determinant of outcomes rather than prediction.
Rather than predicting a single outcome, the simulation applies different XRP/BTC ratios to project potential XRP valuations at corresponding Bitcoin price levels — from bearish breakdowns to highly bullish expansions.
The study argues that XRP’s long-term asymmetric payoff remains intact but emphasizes that the market structure, not sentiment, will determine which scenario eventually unfolds.
#XRP / #BTC Simulation Exercise : Possible Formation and Scenarios and the Mean ($11)📊🔍: Time for a Quick Thread 🧵: The Mean is $11 #XRP, Dig deep with me to see why!!! (1/6): This post explores #XRP price projections using different #XRP/#BTC ratios, each tied to a… pic.twitter.com/3PHIALy70X
— EGRAG CRYPTO (@egragcrypto) November 16, 2025
Scenario A — Bearish Breakdown
The most cautious outcome assumes a breakdown from XRP’s multi-year descending triangle. Under this structure, the XRP/BTC ratio would compress to 0.00001030, resulting in XRP trading near $1.03 if Bitcoin were at $100,000 and $0.309 if Bitcoin were at $30,000.
Although bearish, the model notes that this scenario would still be structurally realistic in macro terms rather than catastrophic.
Scenario B — Bullish Breakout of Descending Triangle
A breakout from the same triangle shifts the ratio sharply to 0.000048, initiating what the analyst calls XRP’s “first macro expansion wave.”
With this outcome, XRP would sit around $4.80 at BTC $100,000, scaling up to $8.16 if Bitcoin reached $170,000.
Scenario C — Macro Falling Wedge Resolution
The third pathway uses the MACRO Falling Wedge breakout ratio — 0.000073, which aligns with a multi-year bullish structure on the weekly chart.
This scenario places XRP around $7.30 at BTC $100,000 and $12.41 if Bitcoin climbed to $170,000.
Egrag noted this pathway currently represents the highest-probability macro outcome if XRP finally clears its years-long compression zone.
Scenario D — Ultra-Bullish Pennant Breakout
The most aggressive model — based on a full Bullish Pennant breakout — uses a ratio of 0.00013, marking a deep expansion phase in XRP’s market cycle.
Here, XRP would reach $13.00 at BTC $100,000 and a massive $22.10 if BTC surged to $170,000.
According to the model, XRP hitting $27 would require Bitcoin to trade around $207,700 if this ratio plays out.
Why the "Average Target" Is $11
Across the four scenarios, the mid-range of price projections converges near $11 per XRP, which is why Egrag identifies $11 as the mean of the entire simulation set — not a forecast, but a mathematical midpoint derived from the structural models.
Investor Reaction
The thread drew strong approval from market watchers advocating multi-scenario modeling over one-directional price calls. Analysts at X Finance Bull Academy wrote that all models point toward the same theme: XRP’s asymmetric upside remains substantial when viewed over a macro timeline.
The author stressed repeatedly that the thread is not a prediction or guarantee but a simulation to map the full range of technically reasonable outcomes. In short: XRP’s future depends on how the chart structure resolves — not on optimism or fear.
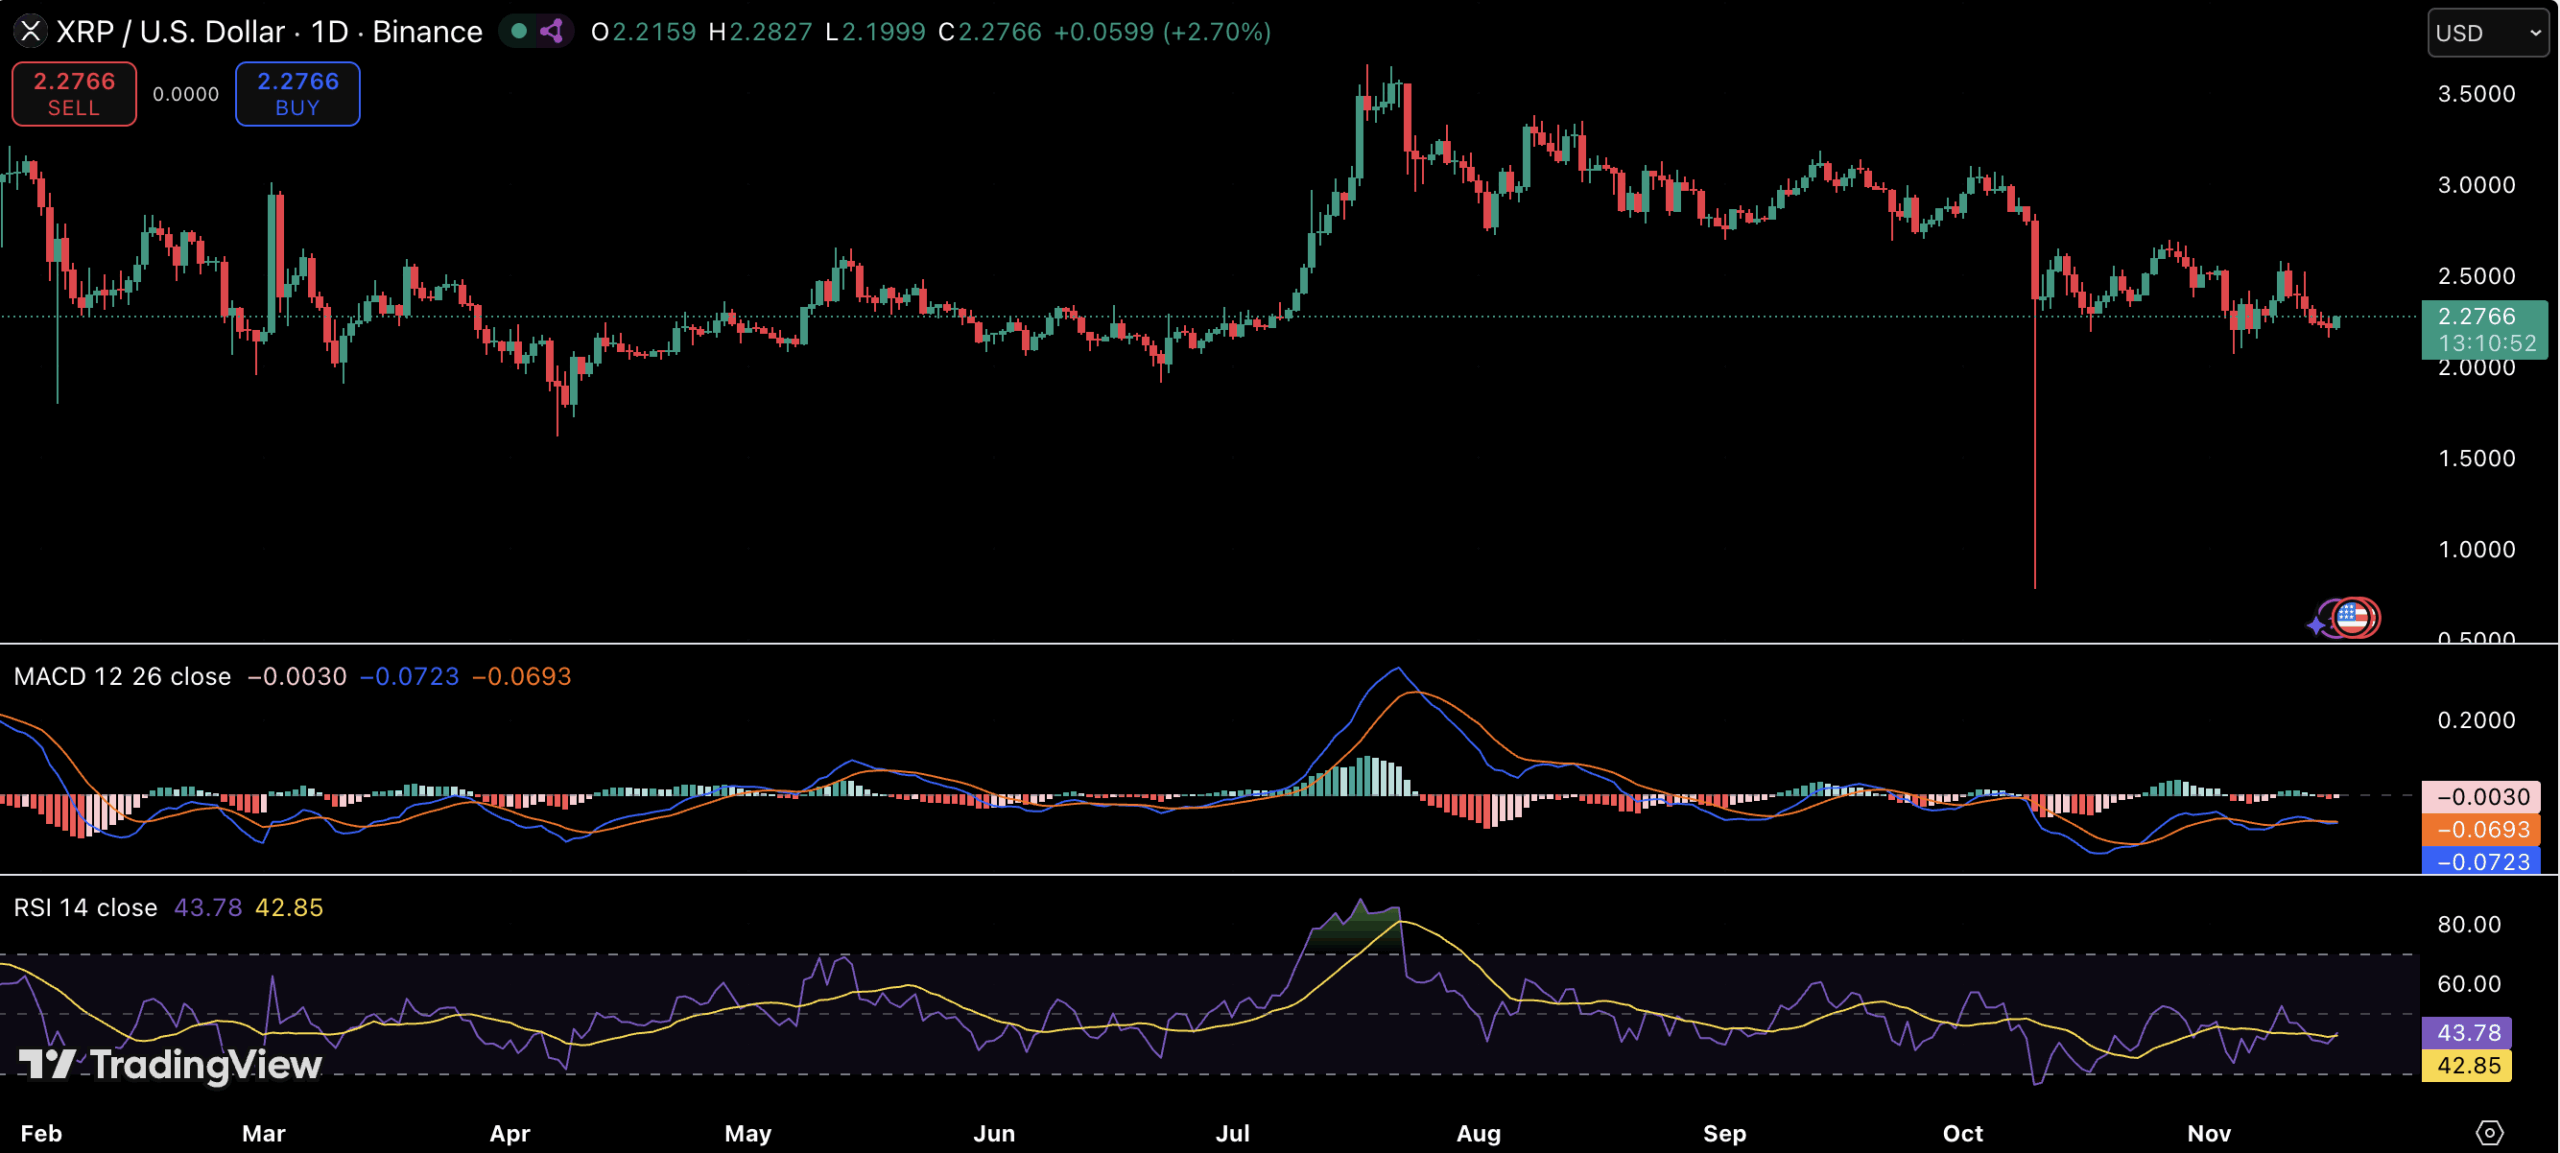
- •RSI (14) currently ~43 → XRP is in neutral-to-oversold territory, showing weak momentum but not extreme selling.
- •MACD is below the signal line with negative histogram bars → indicating bearish trend continuation unless a crossover occurs.
- •Together, both indicators reflect cooling momentum rather than a trend reversal.