
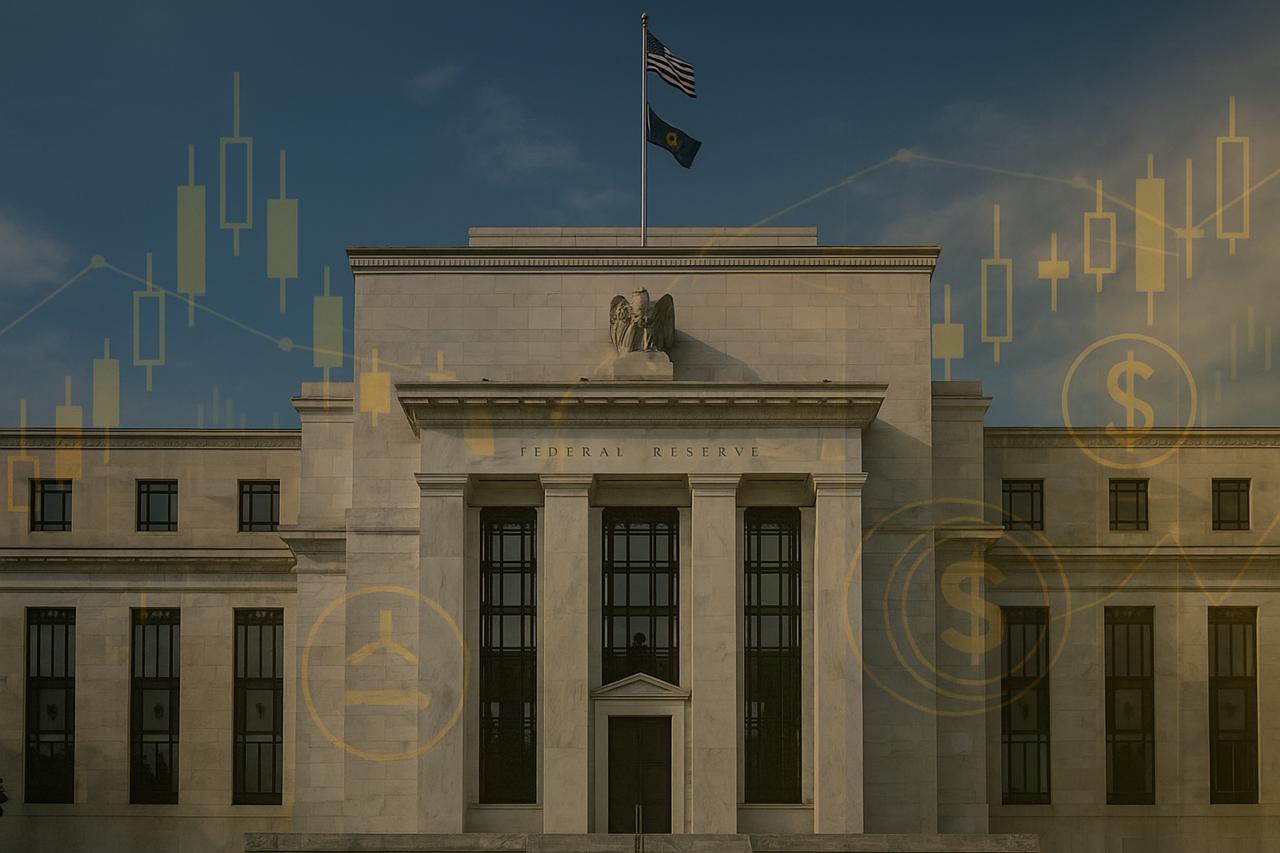
Crypto markets are entering a decisive stretch as the Federal Reserve prepares to pivot and officially end Quantitative Tightening within the next three days. Bitcoin has reclaimed the $90,000 region ahead of the announcement, and analysts are increasingly noting similarities between the current landscape and the macro environment that preceded the major 2020–2021 expansion cycle.
Dan Gambardello is among the voices drawing parallels, pointing to how closely today’s structural signals resemble the conditions seen before the last major bull acceleration. He stresses that the data looks more important than sentiment, especially as liquidity pressure gradually begins to ease and PMI indicators trend toward expansion.
FED pivots and QT ends in 3 days.
Last time this happened, September 2019… $LINK was around $2 (now $13) $ADA was around 5 cents (now .40) $XRP was around 29 cents (now $2)
Same BTC pair levels. Same risk score zones. Different prices.
The macro is lining up. PMI expansion…
— Dan Gambardello (@dangambardello) November 27, 2025
Echoes of 2019 and What It Means for Altcoins
Gambardello highlights that the last time the Fed made the same policy shift, September 2019—several now-established altcoins were trading at a fraction of their current valuations. Chainlink hovered near two dollars compared to today’s levels above thirteen, Cardano traded around five cents rather than forty, and XRP sat near twenty-nine cents before rising to two dollars in this cycle.
While the prices have dramatically changed, he emphasizes that the Bitcoin pair structures, the risk zones, and the rhythm of the broader market look strikingly familiar. For him, the alignment of macro conditions today creates a backdrop that historically favored the early stages of a larger move.
Chart Breakdown: Why Analysts Believe the Structure Is Repeating
The chart he shared places the current BTC structure directly against the multi-year framework that mapped Bitcoin’s behavior leading into previous macro shifts. On the left side, the chart documents how Bitcoin moved through several distinct phases in the years before the 2020 bull run, including a prolonged consolidation zone that resolved upward shortly after the Fed pivot of 2019. Colored trend bands highlight zones such as early expansion, mid-cycle momentum, and the heightened risk area that often precedes major breakouts.
The right side overlays Bitcoin’s current weekly structure in those same zones, showing the asset sitting almost precisely in the risk score region where the previous expansion began. Arrows mark earlier moments when liquidity returned and the Fed increased its balance sheet, each of which aligned with notable upward moves. The chart’s message is simple: despite higher nominal prices, the underlying market rhythm looks uncannily similar to the previous breakout setup.
Why the Macro Shift Matters Now
Gambardello reiterates that he isn’t offering predictions but presenting structural evidence. The combination of easing liquidity pressure, upcoming balance-sheet changes at the Fed, and improving PMI readings creates an environment that historically favored strong upward moves. With Bitcoin stabilizing in the $90K range and the Fed pivot only days away, analysts are watching whether the market follows the 2019 pattern, only this time at far higher price levels and with institutional participation at its peak.
What Comes Next
The expectation is not for an immediate explosion but for conditions that allow a broader expansion phase to unfold if past patterns continue to echo. Traders who study the macro cycles note that shifts like these tend to influence sentiment, liquidity, and long-term positioning across both Bitcoin and major altcoins. As the countdown to the Fed announcement continues, the chart comparison has become one of the most talked-about reference points for understanding where the market may be heading next.