

The SEI price is currently exhibiting a notable chart structure that suggests a potential reversal after a prolonged period of decline. Market analyst Ali has identified early signs of a double-bottom pattern, which, if confirmed, could lead to a significant price breakout.
This technical pattern, one of the most reliable indicators of a reversal, is particularly significant given the extensive downside SEI has experienced. The token has been in a consistent downtrend since early summer, making the prospect of a strong recovery rally a point of interest for traders.
Technical Analysis of the SEI Chart
According to analyst Ali's chart, SEI has formed two distinct cyclical lows, one in early March and another currently developing. Both lows display a similar rounded formation. The critical resistance level, or neckline, for this pattern is situated between $0.34 and $0.36. This zone has previously rejected SEI's price on multiple occasions over the past few months.
For the double-bottom pattern to be validated, SEI must decisively reclaim this neckline and sustain a close above it with strong upward momentum. The current price action shows a shift in trend, with the series of lower highs observed in September and October appearing to flatten out. Buyers are showing increased interest, and the tightening price action suggests a breakout attempt could occur between late November and mid-December.
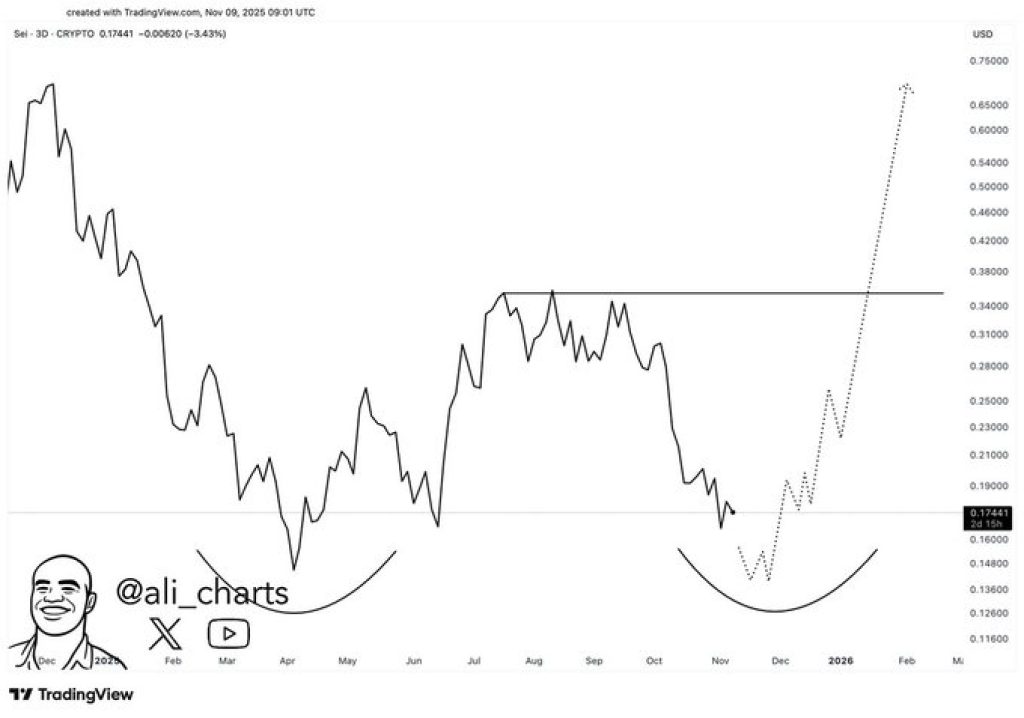
If SEI successfully converts the neckline into support, the measured move indicated by the double-bottom pattern aligns closely with Ali's projection of $0.70. This target represents a potential increase of over 400% from current trading levels.
The strongest support level for SEI is identified in the $0.15 to $0.17 range, which has served as a stable base twice this year. As long as SEI remains above this area, the bullish reversal structure is considered valid. The primary resistance, beyond the neckline, is near $0.42. A breach of these levels could trigger rapid momentum shifts. The chart already indicates an increase in volatility following a period of tight price action, often a precursor to a significant breakout.
SEI Price Outlook: Future Movements
If buyers continue to defend the $0.17 support zone and SEI builds further upward momentum, the market could enter a breakout phase sooner than anticipated. A confirmed reclaim of the $0.34 neckline would pave the way for a move towards $0.42, and subsequently, the $0.70 target. This $0.70 level aligns with historical resistance from early 2024.
Conversely, if SEI fails to hold its second bottom, the bullish setup would weaken, potentially leading the token back towards the $0.15 support. However, the current technical indicators lean towards a more bullish outlook. The double-bottom pattern identified by Ali is closely watched by traders due to its potential for explosive price movements upon confirmation.
The market is now anticipating SEI's next significant move. Should the double-bottom pattern play out as projected, the upcoming weeks could witness considerably more volatility and excitement for SEI holders compared to the preceding months.