

Ethereum is currently trading around $3,300, with a 24-hour trading volume of $34.26 billion. The price has experienced a 3% decrease in the last 24 hours and a 14% decline over the past week.
Despite this recent pullback, analysts are closely monitoring a significant technical setup that could signal a potential long-term shift in trend.
Pattern on Monthly Chart Signals Key Level Ahead
Trader Tardigrade has shared a chart illustrating an Inverse Head and Shoulders pattern forming on Ethereum's monthly timeframe. This pattern suggests a left shoulder formed in late 2024, a head in mid-2025, and the right shoulder is currently under construction.
$ETH/monthly
A massive Inverse Head and Shoulders pattern is forming on the #Ethereum monthly chart, targeting $14,000 🔥
The Right Shoulder is under construction ✍ pic.twitter.com/cRdIwihF2z— Trader Tardigrade (@TATrader_Alan) November 7, 2025
The neckline for this pattern is positioned around the $4,000 to $4,400 range. A confirmed move and close above this range would signify the completion of the setup. The measured move derived from this pattern indicates a potential target near $14,000. Currently, the structure is still developing, with Tardigrade noting that Ethereum is still "building the right shoulder" and the breakout has not yet occurred.
Additionally, Titan of Crypto highlighted the 38.2% Fibonacci retracement level at approximately $3,050. Ethereum recently touched this level and subsequently bounced. This reaction was accompanied by a weekly candle that demonstrated a strong rejection of lower prices.
Titan of Crypto stated that the "bull market remains valid" if Ethereum can sustain this support zone. This level is considered crucial support during pullbacks within larger trends. If this area holds, Ethereum could potentially resume its upward trajectory.
ETH/BTC Pair Finds Support
Michaël van de Poppe has charted the ETH/BTC pair, pointing to a support zone just above 0.0325 BTC. This area has been identified as a potential buy zone, based on historical consolidation and price action.
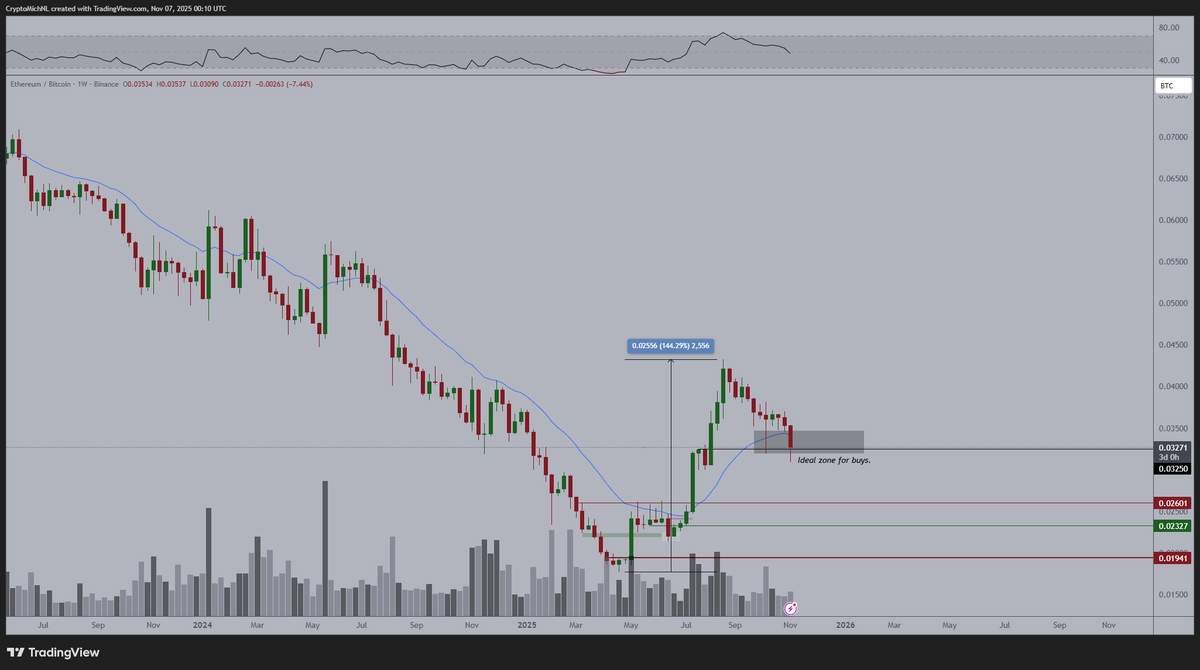
The ETH/BTC pair experienced a bounce after reaching this support level, although it remains below its 9-week exponential moving average. If the asset continues to hold this support and reclaims the short-term trend line, the ETH/BTC chart may exhibit renewed strength. Should the price fall below this level, the next areas of interest are marked at 0.0256 BTC and 0.0199 BTC.
Short-Term Data Shows Selling Still Present
According to CryptoQuant analyst PelinayPA, the Taker Buy-Sell Ratio on Binance continues to remain below 1.0. This indicates that aggressive selling has been more prevalent than buying in recent trading sessions.
In parallel, Bitcoinsensus reported that Ethereum saw a bounce after dipping below $3,300, referring to $5,000 as a "magnet zone." It remains to be seen whether the price can gather sufficient momentum to move towards this level following the recent bounce.