

Market Overview and Analyst Projections
Ethereum is trading near $3,433 amid rising ETF inflows and increased trading volume, while analysts project a near-term retest to $2,000 followed by a longer-term advance toward $10,000 if structural support holds.
Analyst Ali (@ali_charts) has outlined a multi-year framework that places Ethereum on an ascending macro trendline, which has consistently produced higher lows since 2021. Ali’s analysis identifies a crucial structural support band near $2,000–$2,400 as the most likely reaccumulation zone during a corrective phase.
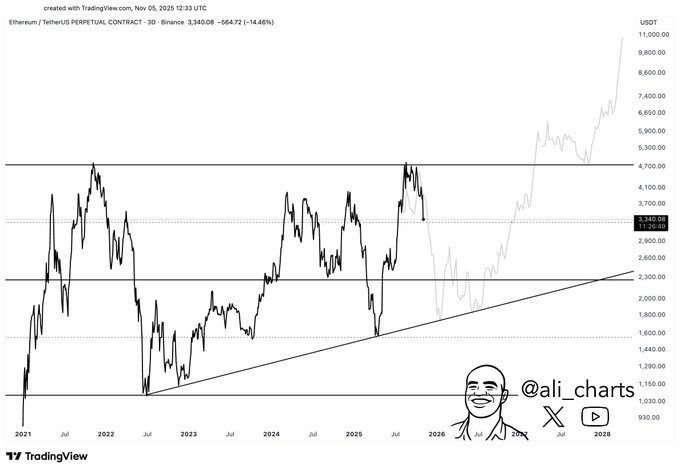
The current chart indicates a clear resistance shelf near $4,700, a level that has capped rallies twice in the current cycle. Ali interprets the present pullback not as a fundamental shift in market regime but as a healthy consolidation phase necessary to rebuild broader market participation. Should the price revisit the $2,000 range and subsequently regain upward momentum, the analyst projects a trajectory toward $10,000 over ensuing cycles.
This perspective views the potential $2,000 retest as a functional market adjustment. Historically, deep retracements that successfully hold long-term trendlines have preceded renewed institutional re-entry. Ali’s framework suggests that long-term holders may accumulate near this base, thereby setting the stage for a multi-year expansion.
ETF Flows and Institutional Demand
On November 6, data indicated meaningful ETF flows across several digital assets. Bitcoin spot ETFs recorded net inflows of $239.9 million, Ethereum saw inflows of $12.5 million, and Solana received $29.2 million. These figures suggest that institutional managers are actively reshaping their exposure to top digital assets.
Institutional inflows often serve as a stabilizing force during periods of consolidation. When professional capital accumulates, the liquidity profile of an asset changes, and volatility commonly contracts. For Ethereum, consistent ETF demand can support price discovery and mitigate the risk of abrupt liquidity gaps during corrective phases.
This institutional participation aligns with and complements Ali’s technical thesis. If these inflows persist even through a retest phase, they could accelerate the transition from consolidation back into a directional uptrend. Such a dynamic increases the plausibility of larger price targets becoming achievable.
Current Price Action and Liquidity Dynamics
The intraday chart for Ethereum illustrates a recent recovery from lows near $3,300 to the current trading price of $3,433 in a V-shaped rebound. Trading volume has notably increased to approximately $40.7 billion daily, a growth that signals renewed trading interest. The Volume-to-Market Cap ratio further supports a narrative of active liquidity rather than subdued market activity.

Ethereum’s circulating supply is currently around 120.69 million ETH, and the post-merge burn mechanism continues to exert downward pressure on supply. This technical supply factor, combined with consistent institutional flows, creates a more constructive supply-demand backdrop that could support higher prices.
With the long-term trendline approaching the $2,000 level and sustained ETF demand, the technical and fundamental bases appear to be in place for a potential multi-year rise toward the $10,000 target projected by the analyst. In the interim, the market is likely to experience fluctuations between reaccumulation phases and staged improvements as greater liquidity actions unfold.