

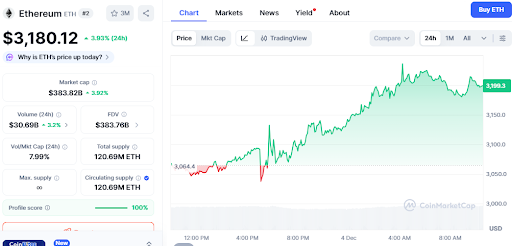
Ethereum is currently trading at $3,180.12, showing a sharp recovery from recent declines. Market data indicates a steady increase in demand around lower values, with traders observing whether ETH can sustain its momentum above short-term resistance. The broader market is also demonstrating signs of stabilization after a period of volatility, drawing attention to upcoming price targets.
Analytical Setup Supporting Current Ethereum Trading Levels
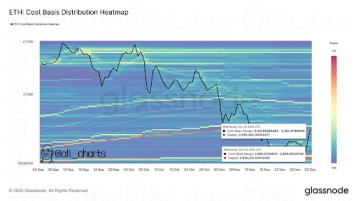
Ethereum's chart displays renewed strength as buyers have successfully defended the $2,800 region. On-chain data reveals that approximately 2.60 million ETH were accumulated near both $3,180 and $2,800. This distribution forms a clear barrier above and a strong support level below, which are central to current Ether price predictions.
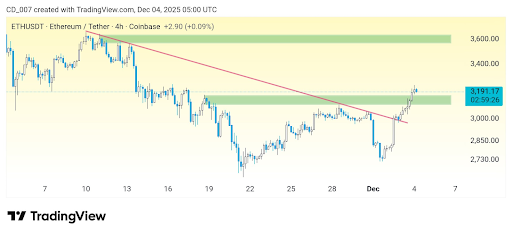
Traders are closely monitoring the 4-hour trendline breakout as ETH continues its recovery. Recent chart patterns suggest that the asset is exhibiting an improving structure and is positioned above short-term moving averages. These indicators align with broader cryptocurrency price prediction models that rely on trend confirmation. When forecasting levels during periods of consolidation, market participants also consider milestones in development and ecosystem activity.
Technical Drivers Behind the Ethereum Price Prediction Outlook
Technical models are being used to identify crucial levels that traders consider important for short-term direction. The resistance at $3,180 signifies significant positioning over recent sessions, while $2,800 remains the strongest support. These areas are instrumental in defining bullish and bearish scenarios that influence forecasts such as the ethereum price prediction 2026 and trading level 2030 predictions.
Momentum indicators are showing improving strength following the recent rebound. Analysts are tracking the behavior of the Relative Strength Index (RSI), moving averages, and liquidity clusters to assess whether the current momentum can be sustained. Market data also indicates increased activity within key trading ranges, which supports a more stable market level forecast across multiple timeframes.
Short-Term, Mid-Term, and Long-Term Scenarios
Short-term projections are contingent on ETH closing above $3,180. A confirmed breakout could potentially lead to a move towards $3,350 and the $3,600 region, as highlighted in recent charts. Conversely, a failure to maintain levels above the current range might result in ETH revisiting the $2,950 mark or the more significant accumulation zone at $2,800.
Mid-term scenarios are focused on whether demand will increase amidst a broader market recovery. Sustained upward momentum could support movements towards the $3,800–$4,000 range, which is consistent with several cryptocurrency price prediction models. Long-term projections, such as those for ethereum price prediction 2030, continue to be influenced by factors like adoption rates, network upgrades, and overall capital flows. These models typically suggest broader ranges, often between 5,500 and 7,000, based on market cycles.
Price Scenarios: Bullish, Bearish, and Base Case
- •Bullish: A decisive break above $3,180 could sustain upward momentum towards $3,360, with a potential continuation to the $3,600 zone.
- •Bearish: A failure to hold current price levels may create downward pressure, testing the $3,000 mark and the more substantial support cluster at $2,800.
- •Base Case: The asset might trade within the established range between these key levels as traders continue to assess market signals.
Conclusion
Ethereum currently exhibits a balanced market structure with clearly defined support and resistance levels. Traders are actively monitoring whether the current momentum is sufficient to overcome the $3,180 barrier. The price action at this critical juncture will provide significant guidance for the future direction of Ethereum's price prediction outlook.