

The Ethereum price experienced a 2% decline in the last 24 hours, trading at $2,805 as of 3:50 a.m. EST. This movement occurred alongside a 20% increase in daily trading volume, reaching $27.18 billion.
Following the dip in the ETH price, Tom Lee’s BitMine, identified as the largest Ethereum treasury firm, re-entered the market with a substantial buy order of $70 million.
⚡️ NEW: Tom Lee's #Bitmine just added another 7,080 $ETH to their treasury. pic.twitter.com/85vKJQ5onb
— Rand (@cryptorand) December 2, 2025
BitMine's current holdings represent over 3% of ETH’s entire supply, with a stated aim to increase this stake to 5%.
JUST IN: BitMine buys 23,773 ETH ($70M) in 72 hours, pushing its holdings to 3.7M ETH — 62% of the way toward owning 5% of Ethereum’s supply.
Tom Lee shifts his BTC ATH prediction again. pic.twitter.com/wvLYBGYMNn
— Jessica Gonzales (@lil_disruptor) December 2, 2025
Ethereum On-Chain Signals Support Long-Term Bull Case
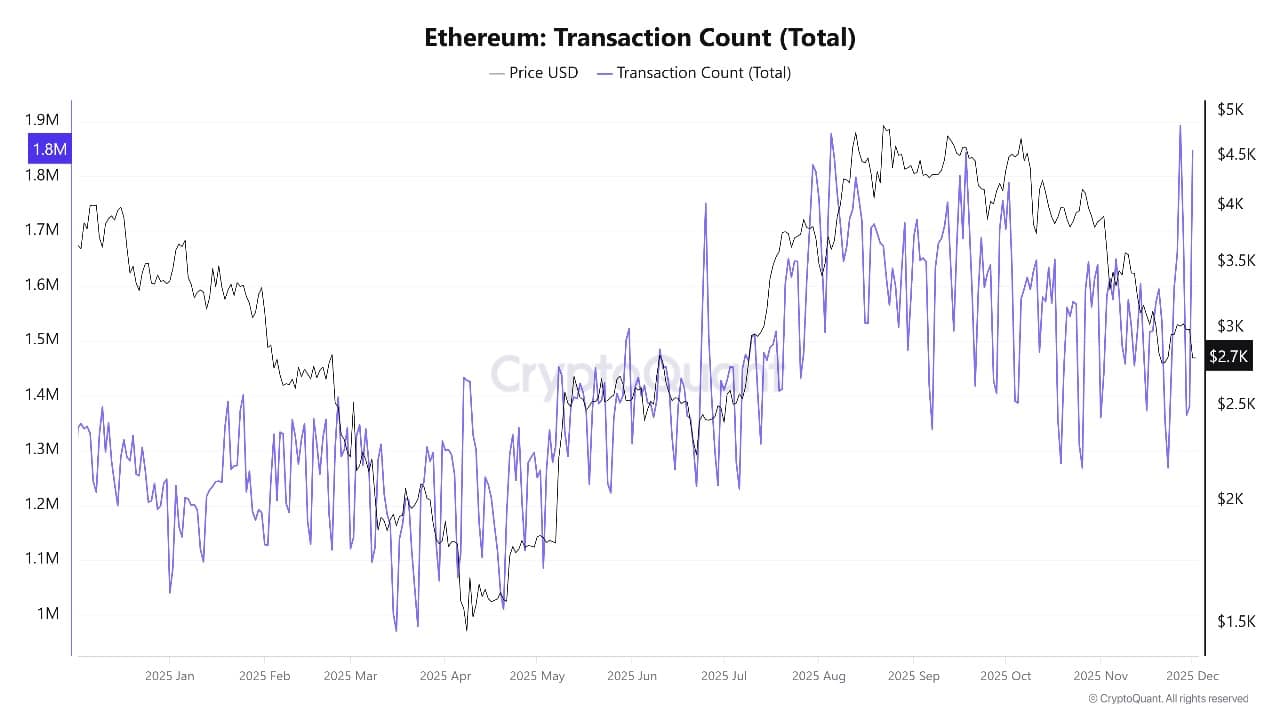
Despite recent price movements, on-chain data for Ethereum continues to indicate a robust underlying network. Analysts report that over 130 million transactions were processed in the third quarter alone, marking an approximate 30% year-on-year increase. This growth is largely attributed to the expansion of Layer 2 networks that ultimately settle on the Ethereum mainnet.
Staking remains a significant factor supporting the long-term bull case for Ethereum. Approximately 35 million ETH are currently locked in validator contracts, representing about 30% of the total supply. This substantial portion is effectively removed from daily trading pressures.
The high staking ratio, coupled with the total value locked in Decentralized Finance (DeFi) protocols nearing hundreds of billions of dollars, suggests a strong commitment of capital to the Ethereum ecosystem by both individual users and institutions, rather than an exodus.
However, data from exchanges and derivatives markets present a more cautious outlook. Ethereum exchange-traded products (ETPs) have experienced significant inflows and outflows in recent months. Some days have seen outflows in the hundreds of millions of dollars, which have exerted downward pressure on price momentum.
Concurrently, futures open interest remains elevated, while funding rates have cooled. This indicates that traders are actively hedging against downside risk, even as long-term holders continue to accumulate assets.
ETH Price Technical Outlook and Prediction
The Ethereum price has broken below the upward-sloping channel that had supported its rise between April and September, indicating a clear shift to a bearish trend.
ETH recently saw a rebound from a low point near $2,700. However, it continues to trade below both the 50-day simple moving average (SMA), which is situated around $3,450, and the 200-day SMA, located near $3,526. This technical positioning suggests that sellers currently maintain control of the market.
Key Fibonacci retracement levels from the previous major rally highlight an important support zone around the 0.786 level, which is approximately $2,140. The intermediate support at the 0.5 level, around $3,165, has already been breached on a closing basis.
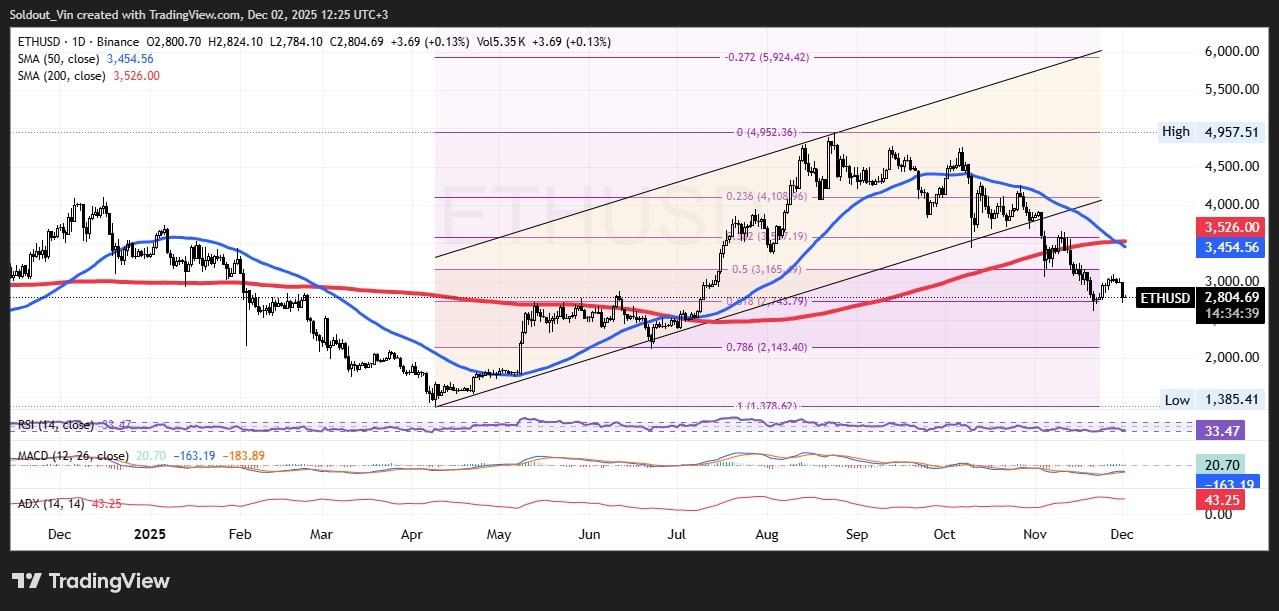
Momentum indicators, including the Relative Strength Index (RSI) trading near the low 30s and a negative Moving Average Convergence Divergence (MACD), corroborate that ETH is in a downtrend. These indicators also suggest the possibility of an oversold bounce if selling pressure diminishes.
In the short term, for a meaningful recovery to be signaled, the ETH price must reclaim the breached 200-day and 50-day moving averages, which are currently around the $3,450–$3,550 range.
Should the bulls falter and the price close back below the $2,700 mark, the chart patterns suggest a potential descent towards the deeper support band near $2,150. This level may attract stronger dip-buying activity.
On the upward trajectory, a decisive break above $3,550 could pave the way for a potential move towards the $3,800–$4,200 range in the coming months.