

Ethereum is showing early signs of resilience after a volatile November, with price action now stabilizing above $2,900. A new comparative chart from Merlijn The Trader highlights an even more compelling dynamic: ETH is tracking almost identically to gold’s four-year consolidation structure, and the pattern suggests Ethereum may be sitting at the same “reaccumulation point” gold hit shortly before its explosive breakout in 2024.
Ethereum’s 4-Year Consolidation Looks Uncannily Similar to Gold’s
The first chart places Ethereum inside a well-defined multi-year range, stretching from early 2021 to today. ETH has repeatedly tested both the lower boundary near $1,000 and the upper boundary around $4,800–$5,000.
Gold followed a nearly identical four-year structure between 2020 and 2024:
- •A clear top around $2,100
- •A long consolidation marked by wide swings
- •A final dip toward the lower boundary
- •A major breakout to new all-time highs
The visual comparison marks ETH’s current position with a green circle, the same position gold occupied before it began a powerful, uninterrupted rally. Gold’s breakout saw it launch from roughly $1,850 to above $2,350 in a matter of months.

If the fractal continues holding, ETH could be at the equivalent “spring phase” of its long consolidation cycle.
Short-Term Price Action Shows a Stabilizing Market
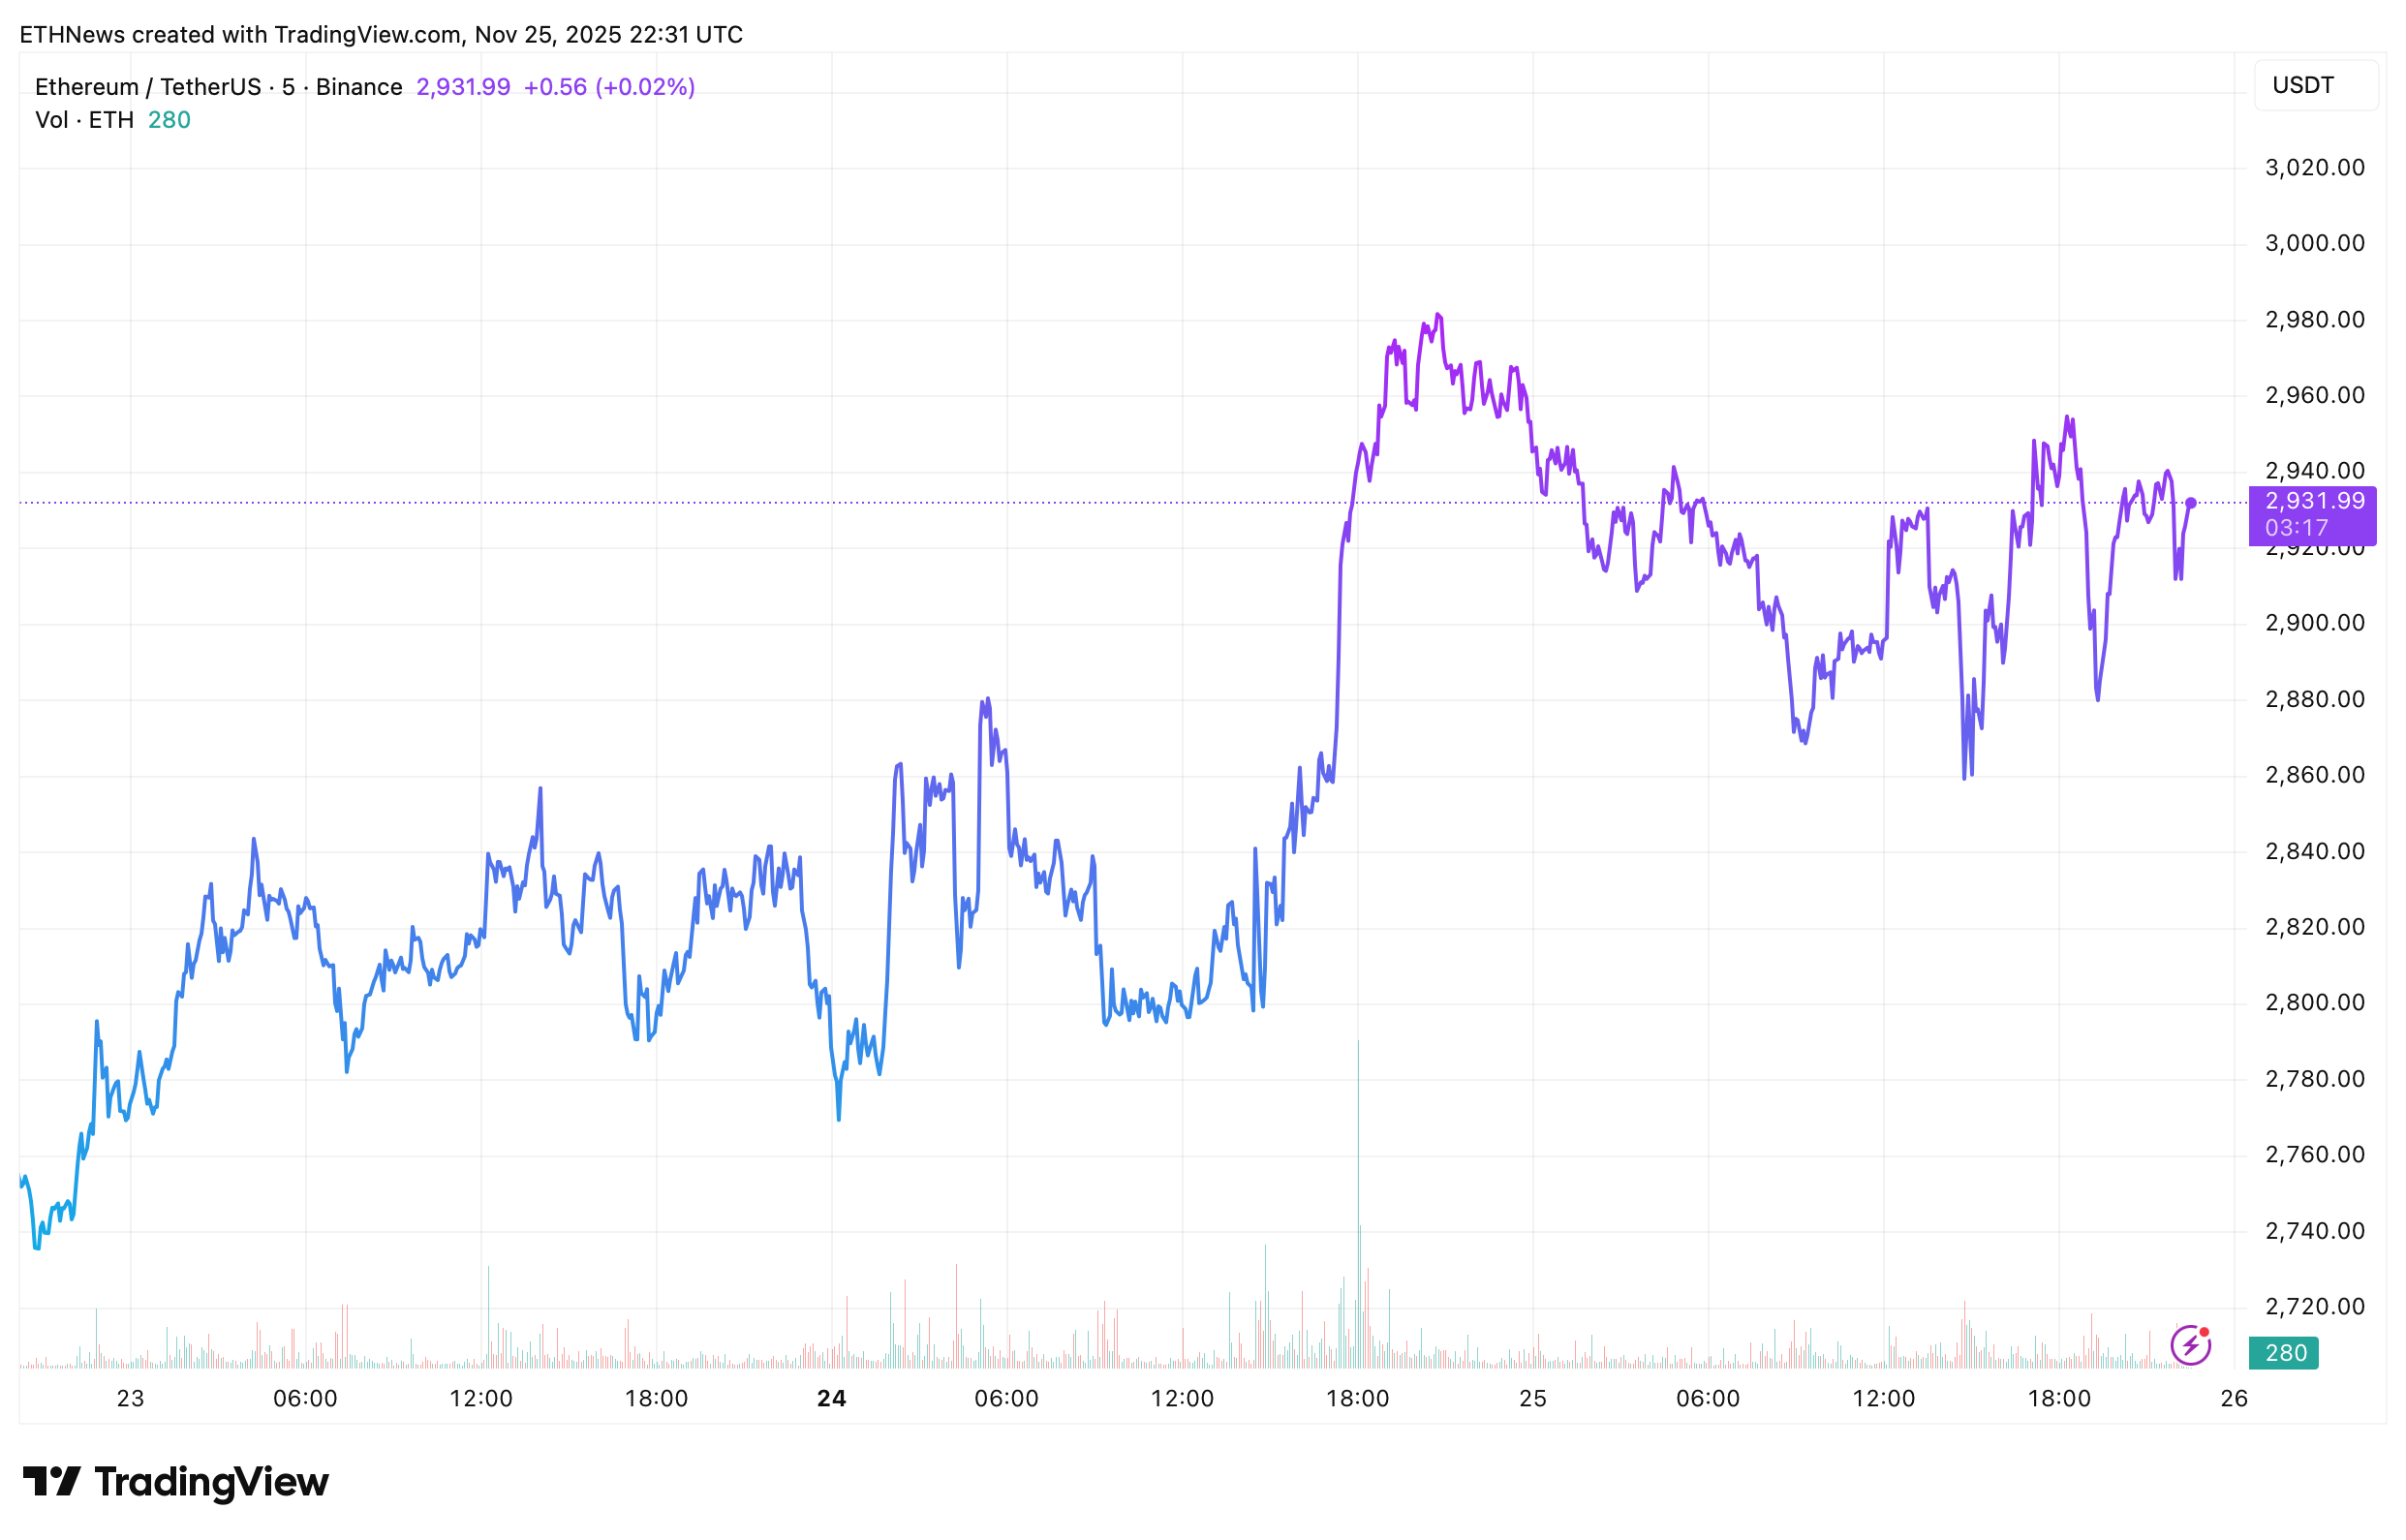
The TradingView chart adds shorter-term confirmation. Over the past 48 hours, ETH put in a clean rebound from the sub-$2,850 region, followed by a sharp upside move toward $2,980, and now trades steadily above $2,930.
The structure shows:
- •A selloff early in the week
- •A strong, fast reversal
- •A shift to tighter, sideways trading, often a sign that volatility is compressing ahead of a larger move
The fact that ETH reclaimed the $2,900 zone and is holding it despite broader market fear adds weight to the idea that buyers are stepping in at higher lows.
Market Indicators Still Caution Against Overconfidence
The broader trend metrics show mixed signals. ETH trades at $2,929, well below its 50-day SMA ($3,625) and 200-day SMA ($3,390), reflecting how much ground it lost during November’s drawdown. Sentiment remains bearish, and the Fear & Greed Index sits at 20 (Extreme Fear), a level that historically appears during late-cycle corrections rather than early ones.
Volatility remains elevated at 11.87%, showing the market has not yet settled into the calmer conditions typically seen before sustained uptrends. RSI at 37.87, however, has moved back into neutral territory after being oversold earlier in the month, suggesting seller exhaustion is developing.
The Bigger Picture
The gold fractal suggests Ethereum may be entering a major cyclical pivot point. The short-term charts show price stabilizing above a key support band, while sentiment indicators reflect a market still shaken from recent sell pressure, an environment often associated with bottom formation.
Ethereum is still below major moving averages, and long-term resistance near $5,000 remains untouched. But the confluence of the multi-year consolidation structure, the historical fractal with gold, and the recent recovery above $2,900 positions ETH at a potentially important moment.
If the pattern continues to rhyme, Ethereum could be approaching the same breakout phase gold experienced after years of accumulation, but the market still needs confirmation in the form of regained trend levels and improving sentiment.