

Ethereum trades around $3,000 as a combination of technical exhaustion, shifting derivatives positioning, and repeated intraday swings shape the asset’s short-term structure. Market conditions show fading momentum while buyers attempt to defend key psychological levels.
- •Ethereum forms a potential exhaustion zone as the TD Sequential prints a sell setup near resistance levels.
- •Funding data shows long-biased traders paying shorts while price trends lower, signaling structural fragility.
- •Intraday volatility around $3,000 shows reactive buying but limited follow-through as markets seek firmer support.
TD Sequential Warns of Pullback Near Resistance
A sell signal from the TD Sequential indicator places Ethereum in a potential exhaustion zone. According to a chart shared on social media by analyst Ali (@ali_charts), the setup appears after a steady advance that lifted ETH toward a near-term resistance area. This move produced a sequence of smaller candles, signaling slowing trend strength.
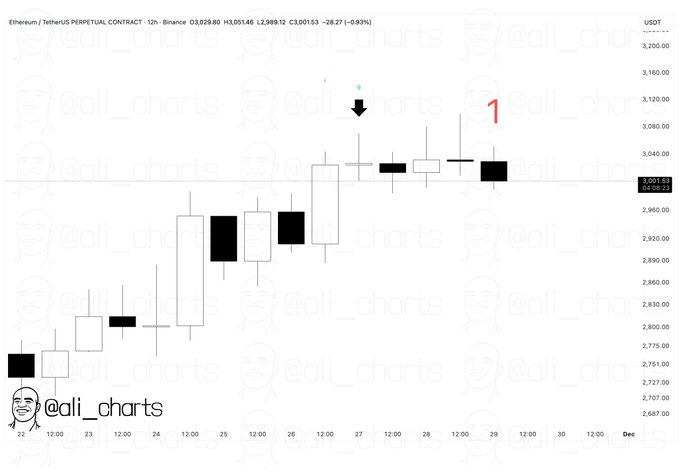
The recovery gained momentum starting on the 22nd, as the improving lows and powerful bull-like candles drove the price up to $3,100. But the follow through on the breakout was weak and ETH failed to close with authority above the upper limit. The structure shows hesitation as wicks widen and bodies compress.
The candle marked “1” introduces the next sequence under resistance, reinforcing the maturing trend. With ETH positioned near $3,000, a loss of this level on a twelve-hour close could push price back toward the consolidation band formed earlier between the 25th and 27th.
Funding Rate Behavior Reveals Mixed Derivatives Positioning
Volume-weighted funding trends show alternating behavior as Ethereum’s price drifted lower over recent months. Funding remained positive through early September, showing that longs maintained control even as price hovered above $4,700. Traders paid to hold leveraged exposure, though conviction gradually softened.

Late September brought repeated dips into negative funding as price slipped below $4,300. These negative prints reflected growing short activity while buyers hesitated. Although funding returned to positive levels in early October, price failed to reclaim earlier momentum, suggesting weaker upside participation.
A sharp negative funding spike near October 10–12 signaled intense short-side pressure during a rapid downturn. Even as funding later normalized, price trended downward toward $2,900. This divergence suggested long-biased traders attempted to stabilize the market, yet the structure remained fragile.
Short-Term Price Swings Center on the $3,000 Threshold
Short-term action shows Ethereum repeatedly testing the $3,000 area with volatility on both sides of the level. Early periods saw ETH below the threshold as sellers drove quick moves toward the $2,970–$2,980 range. Each dip found reactive buying but lacked sustained strength.
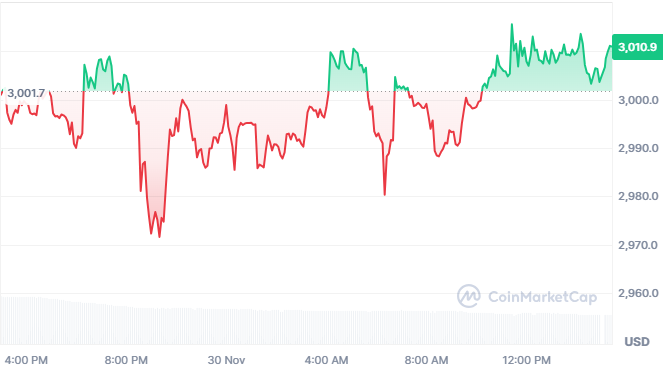
As the session advanced, ETH reclaimed $3,000 and briefly consolidated above it. Several pullbacks tested the threshold again, showing the market’s uncertainty as buyers attempted to turn the level into short-term support. These swings reflect a cautious environment shaped by thin liquidity pockets.
Later movement brought a push toward $3,010 before settling near $3,004. The pattern indicates an early attempt to build a base, though momentum remains limited as traders assess support strength around this key marker.