

Price Action and Historical Parallels
Ethereum (ETH) has experienced a significant downturn over the last three months, declining from a peak of $4,960 to a low near $3,000. This price movement bears a striking resemblance to the correction observed in 2020, when the asset fell from $490 to $308 before initiating a substantial rally. Analysts are drawing parallels between these two periods as ETH shows signs of recovery.
Crypto analyst Galaxy has highlighted that both correction phases involved a notable price drop. In 2020, ETH demonstrated a strong rebound after reaching a low of $308. In 2025, ETH saw a dip to $3,064 and is currently trading above $3,500. Galaxy suggests that the market might be repeating a similar pattern.
$ETH went trough a similar correction back in 2020.
2020: $490 to $300
2025: $4900 to $3000If you ask me, we’re just getting started. pic.twitter.com/l0P3SEZvxh
— Galaxy (@galaxyBTC) November 10, 2025
The critical support zone for ETH is now identified between $3,000 and $3,100. A sustained hold above this support level could pave the way for a robust recovery, mirroring the trajectory of the previous cycle.
Additionally, Cas Abbé has pointed to comparable setups in 2025. Earlier in the year, ETH experienced a decline followed by a 100% rebound. This suggests that the recent move towards $3,000 might have been a false breakdown.
Key Support and Resistance Levels
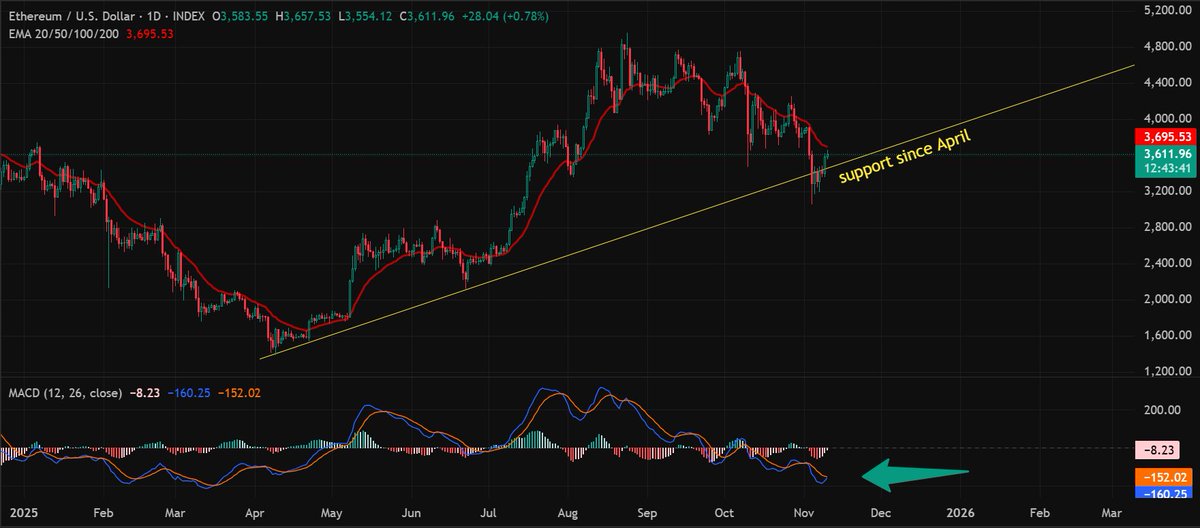
Lark Davis has noted that ETH is currently maintaining its position above a trendline that has provided support since April. While this support line remains intact, short-term selling pressure persists. The 20-day Exponential Moving Average (EMA) is acting as resistance, currently situated around $3,695, and ETH has yet to achieve a daily close above this level.
Concurrently, the Moving Average Convergence Divergence (MACD) indicator is nearing a bullish crossover. Davis commented on the situation, stating, "Support vs. resistance vs. momentum – something’s about to give."
Ethereum is presently caught between these key levels, indicating that a breakout or breakdown could occur imminently, depending on which force prevails.
Whale Activity and Liquidity Dynamics
Bitcoinsensus reported that ETH saw a rapid reversal after sweeping lows around the $3,350 mark. This swift upward movement may have been triggered by a liquidity grab. The next significant area of interest for traders is anticipated to be near $4,950, where both resistance and additional liquidity are present.
PRIME 𝕏 reported that substantial holders began accumulating ETH when the price reached $3,200. If the support zone between $3,000 and $3,400 holds firm, price targets in the range of $4,500 to $4,800 could become attainable. Whale activity within this price bracket might contribute to a sustained upward trend. However, Ali Martinez noted a contrasting trend, reporting that 23 of the largest ETH whales have either sold or redistributed their holdings over the past week.
This activity occurs amidst record-breaking levels in ETH trading volume and open interest, as previously reported. Some market observers suggest that speculative trading is currently a more significant driver of price movements than long-term holding strategies.
Furthermore, BitMine released its latest holdings data on November 10, 2025. The company disclosed holdings of 3.5 million ETH, valued at $3,639 per ETH, alongside significant positions in Bitcoin and other digital assets. This reported allocation suggests continued institutional exposure to Ethereum, even amidst market volatility.