

Key Insights
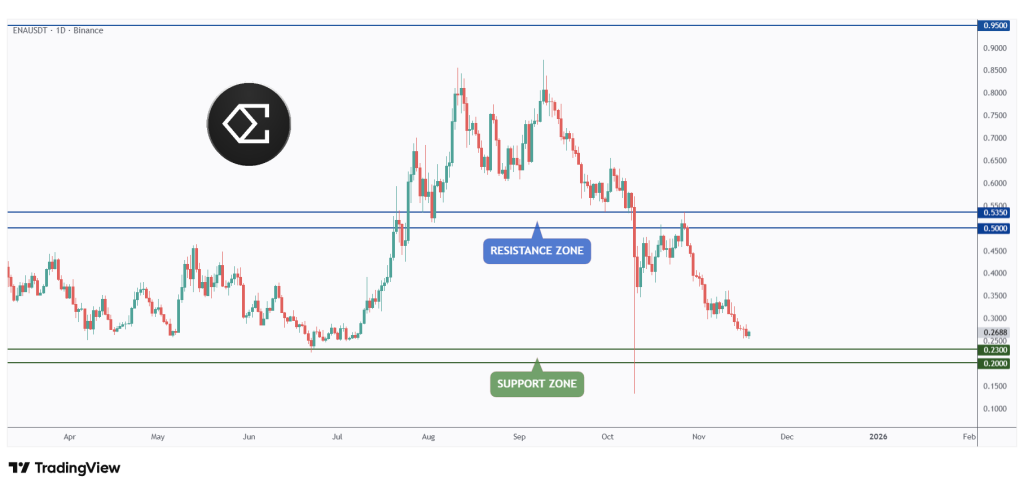
- •ENA faces bearish pressure but shows signs of a potential reversal at $0.20 support.
- •A falling wedge pattern hints at waning bearish momentum and an upcoming price breakout.
- •A possible surge to $0.95 is anticipated if key resistance levels are broken with increased volume and bullish sentiment.

Ethena (ENA) token has experienced consistent bearish pressure for nearly a month. Recent market activity suggests a possible shift. The token is currently retesting its $0.20 support level, which has held firm in the past.
Potential for a Surge to $0.95
ENA has been forming a falling wedge pattern, which typically indicates that bearish momentum is weakening. Analysts believe that ENA could experience a sharp upward movement. The mid-range price target for this potential rally is observed at $0.60, with predictions suggesting that the token could reach as high as $0.95 if bullish momentum gains traction.
However, the path to this surge is contingent upon key factors such as trading volume and overall market sentiment. Traders are actively seeking confirmation that ENA can successfully break through established resistance levels before considering long positions. Currently, ENA is testing significant support levels, and the market is awaiting definitive signs of a potential reversal.
Current Market Conditions for ENA
Over the past month, ENA has demonstrated a decline in price, falling from higher valuations. At the time of this report, the token's value stands at $0.246, accompanied by a 24-hour trading volume exceeding $270 million. Despite the prevailing downtrend, some market analysts identify potential for recovery, particularly as the price approaches a critical support area.
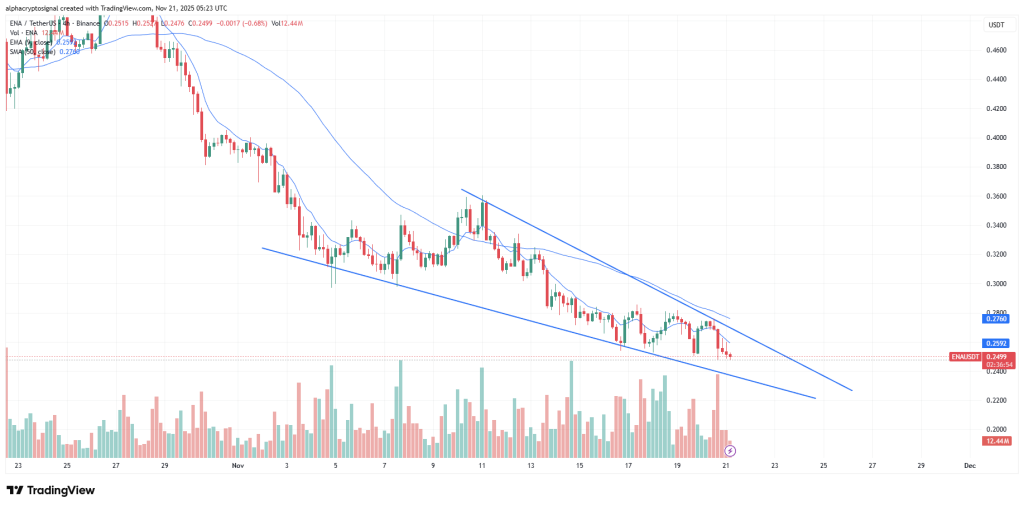
According to Alpha Crypto Signal, ENA is currently forming a distinct falling wedge pattern. This pattern often suggests a decrease in bearish momentum and anticipates an upcoming reversal. The formation indicates that a change in market direction may occur if specific conditions are met. With the token actively testing support levels, investors are closely monitoring for indications of a reversal.
Technical Analysis and Key Levels
A falling wedge pattern is generally interpreted as a bullish signal, suggesting that the downward momentum in the market may be decelerating. The lower boundary of this wedge pattern aligns with the $0.20 support level, an area that has historically shown robust buyer interest.
“Volume is stabilizing, and price is pressing into the wedge’s lower boundary – a zone where ENA has repeatedly shown reactive bids,” noted the Alpha Crypto Signal. Should ENA successfully breach the upper trendline of the wedge, this action could potentially trigger a significant rally, driving the price upwards.