

Grayscale Dogecoin ETF Goes Live, Boosting DOGE Price
The Dogecoin price has experienced a 3% increase in the last 24 hours, trading at $0.1482 as of 3:45 AM. This surge is accompanied by a 10% rise in trading volume, reaching $2 billion.
This price movement follows the launch of Grayscale's GDOG DOGE ETF on NYSE Arca yesterday, marking the first regulated spot exposure to the meme coin in the United States. The fund provides investors with a new, regulated avenue to invest in Dogecoin without direct ownership.
$DOGE about to trigger the bullish reversal 🐶
Eyes here as the #Grayscale#Dogecoin ETF went live in the US 🇺🇸 today. Ticker is $GDOG
From joke coin to Wall Street 👀 pic.twitter.com/98fIQg6awm
— Rand (@cryptorand) November 24, 2025
Early trading for GDOG saw volumes approaching $11 million, indicating significant interest from both retail and institutional investors.
The Dogecoin price climbed to $0.149 following the DOGE ETF's debut, recovering from its early November lows. This uptick occurred after a period of weaker performance, during which the broader cryptocurrency market declined by nearly 7% over the past week.
Dogecoin Network Activity Shows Stable, Though Slow, Growth
On-chain metrics for Dogecoin reveal an increase in daily active addresses and transfer volumes, which are currently around 29.6K. This indicates consistent usage of the network, irrespective of price fluctuations.
The network activity chart highlights two significant spikes: one in early 2024 and another in early 2025. These surges were brief and likely attributed to major news events or substantial movements of large wallets. Outside of these instances, network activity has remained relatively stable, with minor fluctuations.
This steady trend suggests that Dogecoin maintains an active community, although its growth is not accelerating. The network is holding its ground, but there is no strong indication of new user adoption.
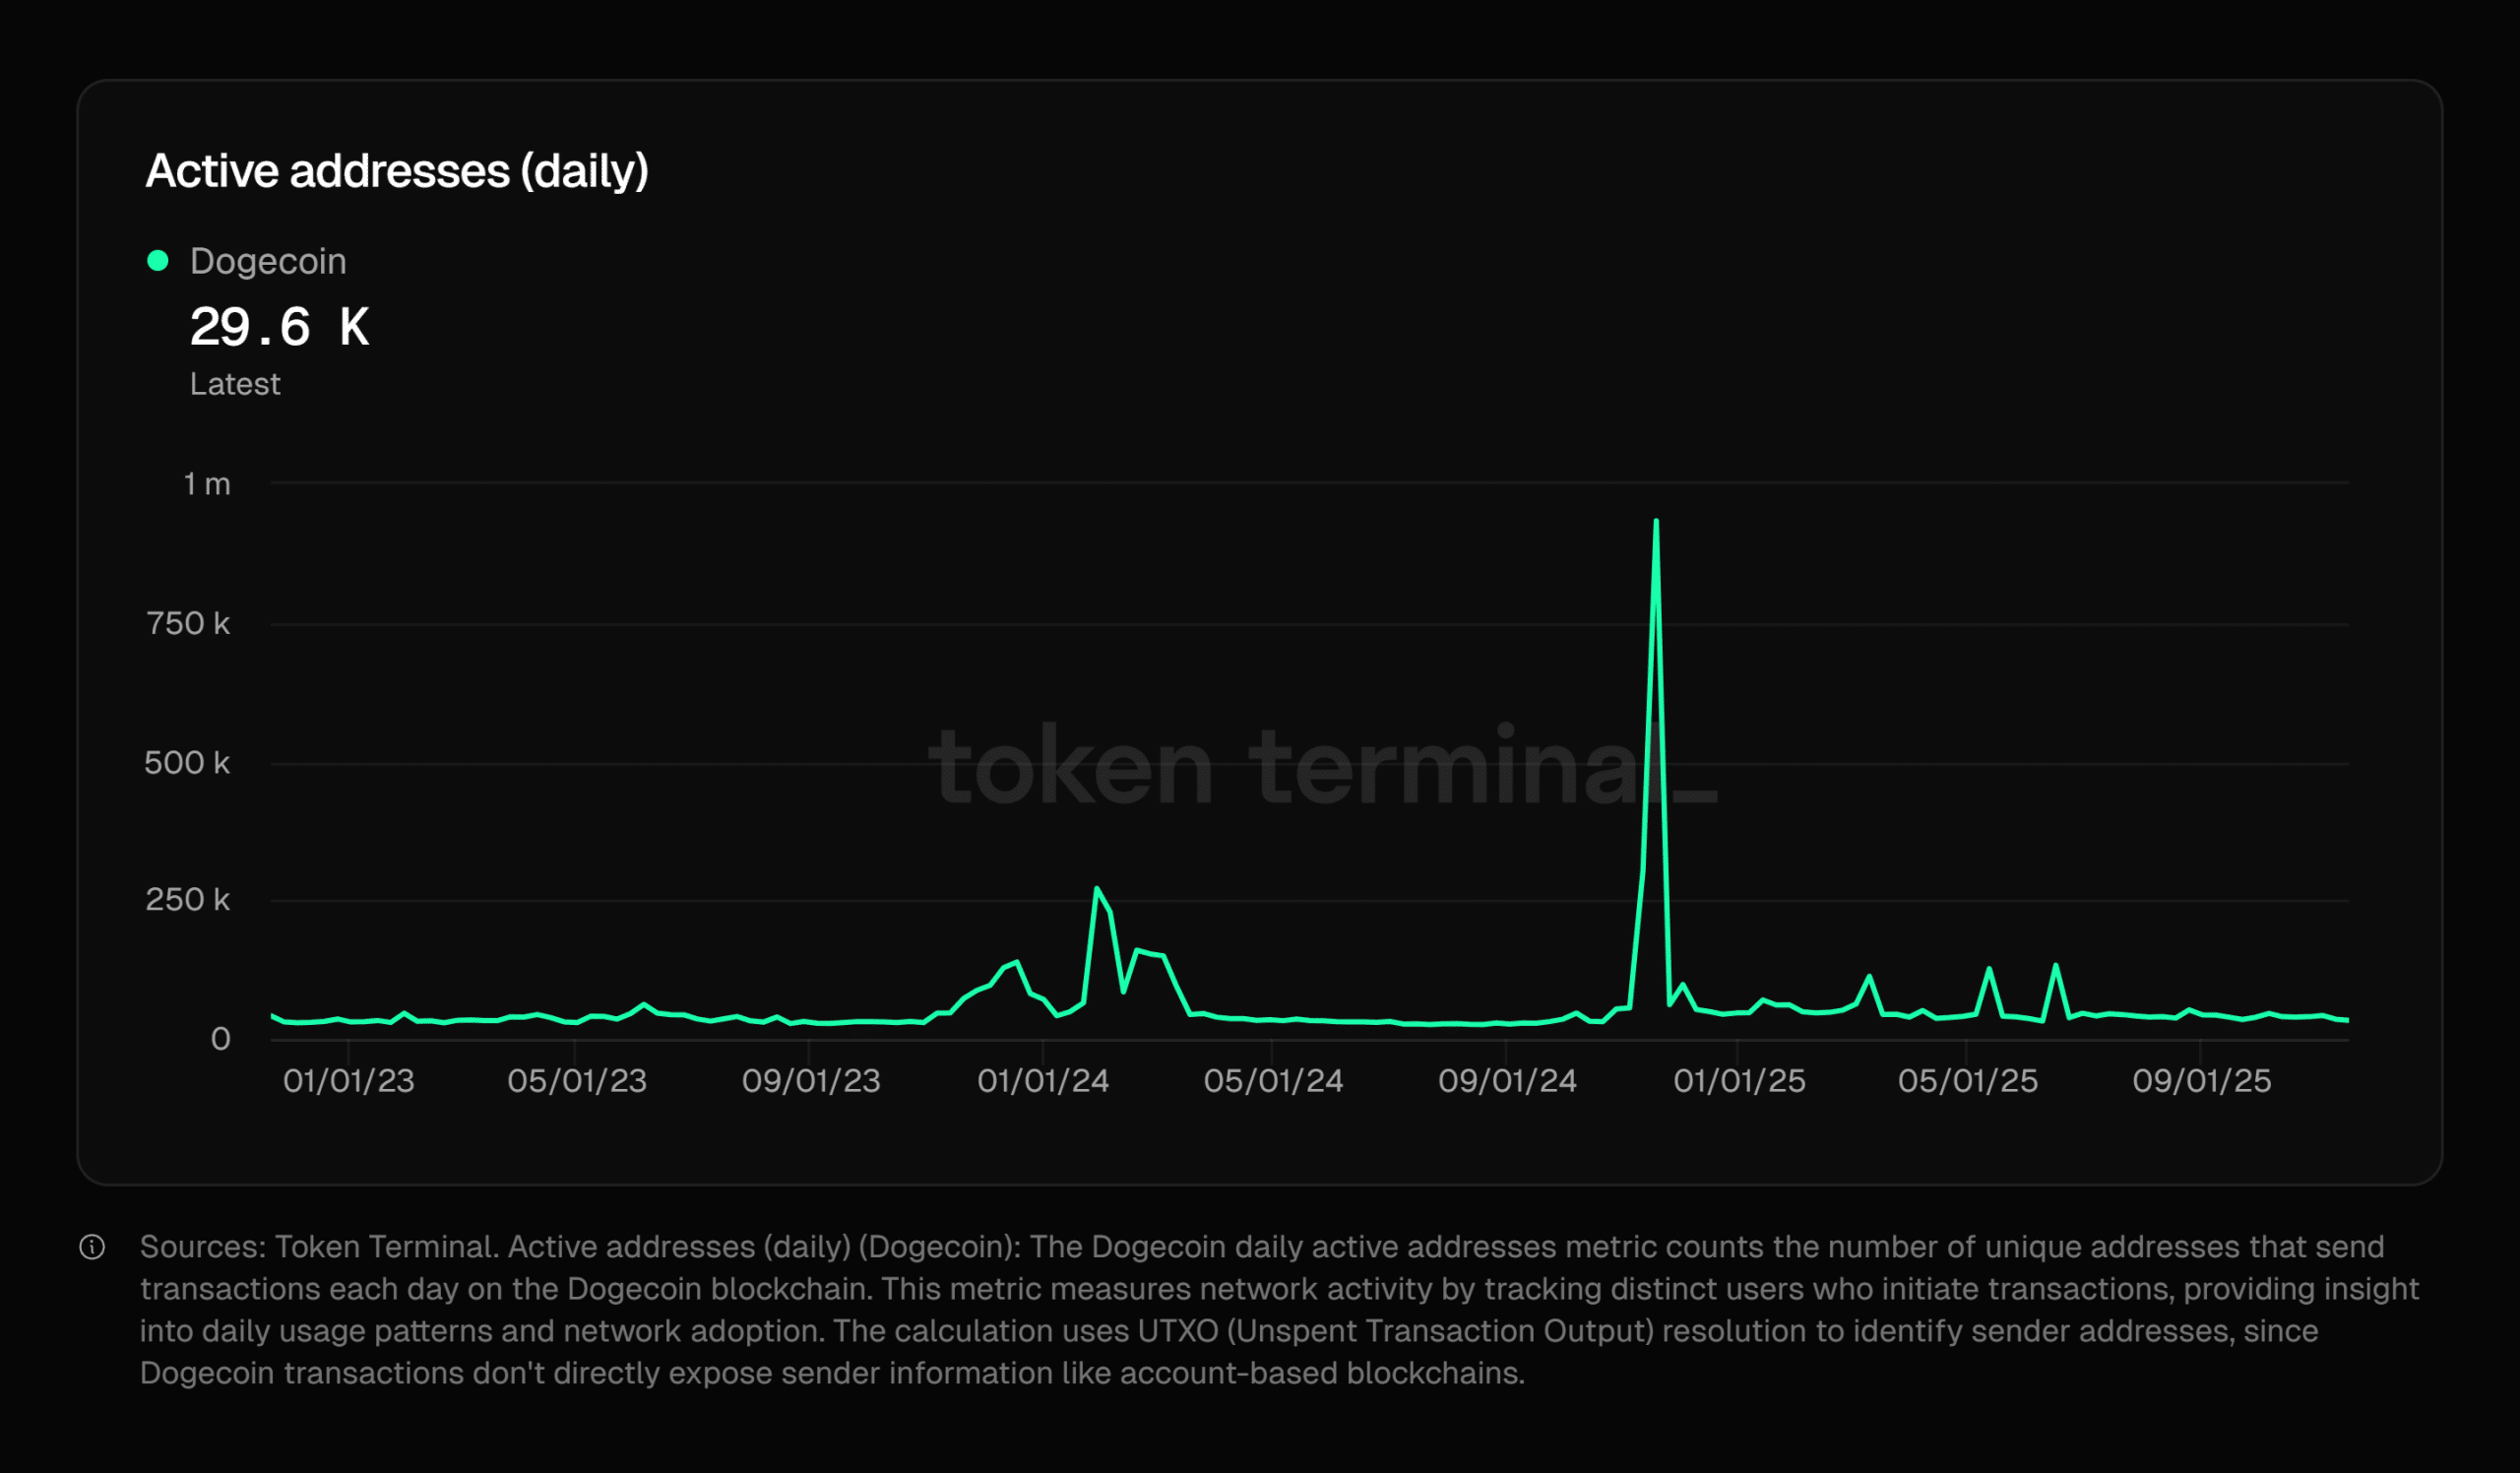
For Dogecoin to achieve stronger bullish momentum, a consistent rise in daily active addresses would be necessary to signify growing utility and broader network participation.
Dogecoin's user activity appears stable but is not expanding rapidly. While its core community continues to transact regularly, there is no strong trend indicating increased long-term adoption.
Dogecoin Price Analysis: Potential Uptrend or a False Start?
Dogecoin's daily chart suggests a strong rebound from the significant support zone around $0.088. The price is now advancing towards the first resistance level at $0.164 and a secondary resistance at $0.207.
The upward movement is supported by increasing trading volume and positive sentiment surrounding the ETF. However, several indicators are displaying mixed signals, suggesting that bullish momentum might encounter challenges as the price approaches these resistance levels.
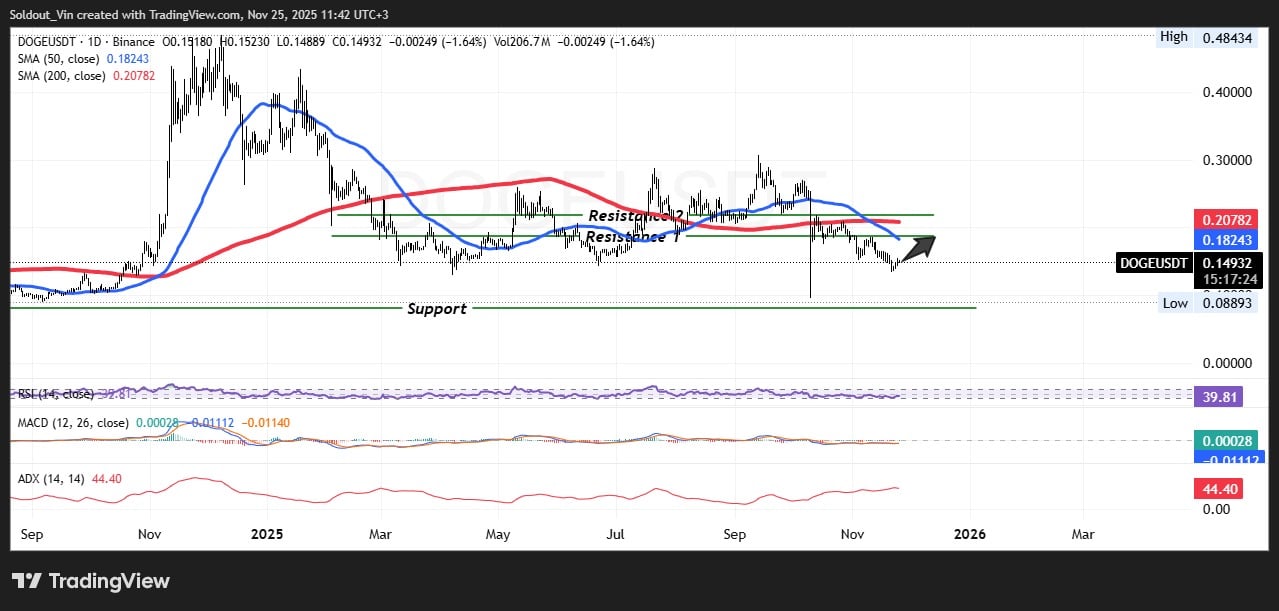
DOGE has been trading within a sideways range for several weeks, but a sharp bounce from mid-range levels is currently shifting short-term sentiment. The price remains below both the 50-day and 200-day moving averages, indicating that bulls need to exert further effort to confirm a full trend reversal.
The Relative Strength Index (RSI) is at 39.81, suggesting that DOGE is not overbought and has room for upward movement if momentum improves.
The MACD indicator shows a slightly positive trend, hinting at a potential change in direction if buying pressure continues. Concurrently, the Average Directional Index (ADX) stands at 44.40, indicating that the current move possesses some strength but has not yet reached breakout levels.
Support at $0.088 Holds Firm as Bulls Target $0.164
Recent price action demonstrates that the $0.088 level continues to serve as a structurally strong support zone for Dogecoin. Buyers have consistently absorbed selling pressure whenever the price approaches this area.
On the upside, resistance levels are clearly defined at $0.164 and $0.207. Both of these levels have previously rejected bullish attempts during prior rallies. A confirmed breakout and sustained close above the first resistance at $0.164 could pave the way for a potential move towards the secondary resistance near $0.207, where sellers have historically shown significant activity.
However, a failure to maintain levels above the $0.149 mid-support could trigger renewed downward pressure, increasing the likelihood of another test of the $0.088 demand zone. At present, technical indicators lean slightly bullish, with expanding volume supporting the recent upswing. Nevertheless, mixed signals from oscillators suggest that a degree of caution remains advisable.