

Dogecoin continues to trade within a compressed structure across yearly, derivative, and 12-month price views. Current data shows consolidation, low leverage conditions, and controlled market drift as participants reassess positioning after a long cooling phase.
Yearly Structure Holds Within a Tight Range
Dogecoin’s yearly chart shows four consecutive inside candles, forming a rare long-term compression. These candles remain within the boundaries of the large 2021 mother candle, which still defines the broader range. The current arrangement keeps price within the upper portion of this macro zone.
Analyst Cantonese noted that this structure suggests consolidation rather than decay. The pattern forms near the higher band of the historical cycle, creating a position where assets typically stabilize before a broader shift. This occurs even as momentum remains subdued across shorter periods.
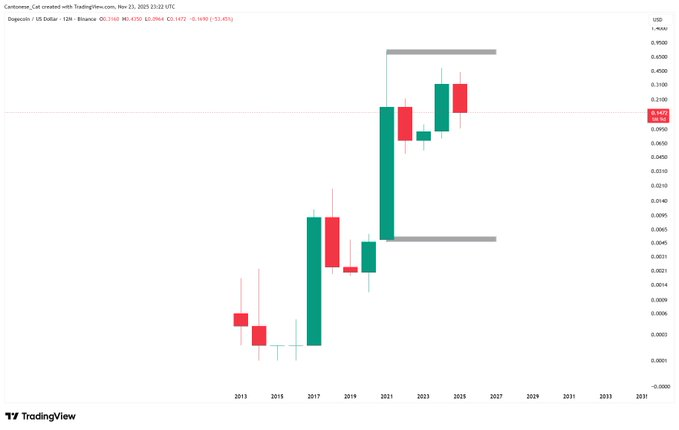
DOGE continues to maintain higher bases with each of the inside candles. That steady base formation has prevented a return to prior demand layers. Market positioning remains anchored to the idea that the primary trend still leans upward while compression persists at a multi-year scale.
Funding Conditions Stay Muted Across Derivatives
The OI-Weighted Funding Rate chart shows a series of flat readings for extended stretches. Funding turned negative through early summer, reflecting caution among traders as DOGE drifted lower. Price action during that period remained stable, with no forced liquidations.
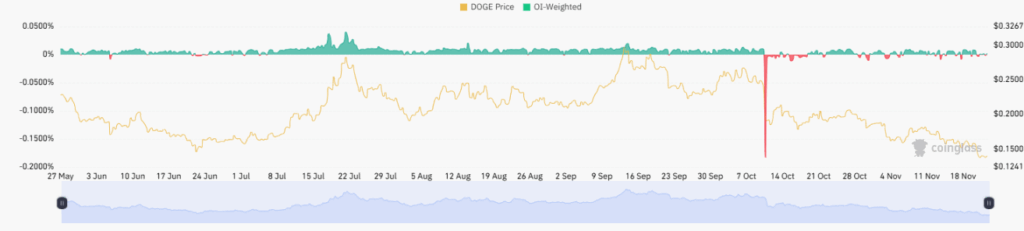
Mid-July showed a mild recovery as funding turned slightly positive. DOGE lifted from local lows during this window, although funding barely rose above neutral. This signaled that the move was not driven by overextended leverage but by controlled participation.
A sharp negative spike in October represented a brief liquidity event. However, funding swiftly normalized after the move. The market then returned to a mildly negative posture, with price gradually slipping lower. Traders continued to maintain a defensive stance without aggressive long exposure.
One-Year Trend Reflects Slow Market Reset
As of the one-year chart, DOGE trades around the area of $0.145, and it has decreased by 66.2% in the last one year. Price action developed a series of low highs to the beginning of 2024, then a general drift around the range of $0.12-$0.22 between the spring and the end of the summer. Market activity signaled a transition from sharp swings to narrow movement.
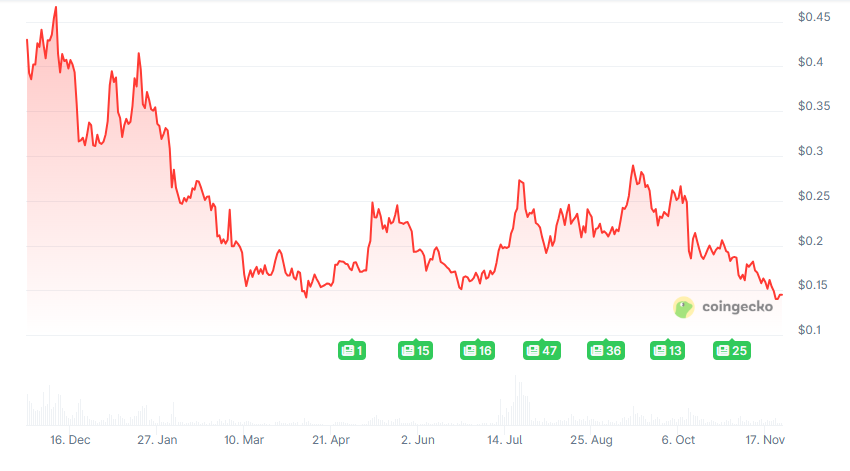
DOGE held stable volume even as price compressed. This showed that participation continued but without directional conviction. Several short rallies toward $0.25–$0.28 faded as overhead supply remained present. Price returned each time to the mid-range zone.
Market cap near $22 billion and steady trading volume reflect a market without extreme positioning. DOGE remains above its larger multi-year support, holding a broad reset structure. Conditions align with a phase where supply rotates before new trends emerge across longer horizons.