

Key Insights
- •Dogecoin's third falling wedge formation mirrors historical patterns that preceded significant price breakouts of over 200% and 370%.
- •A potential 450% breakout could target the $1 price level, contingent on confirmation from price action at resistance levels.
- •The Stochastic indicator on the daily chart suggests DOGE is in an oversold zone, hinting at a possible short-term price bounce.
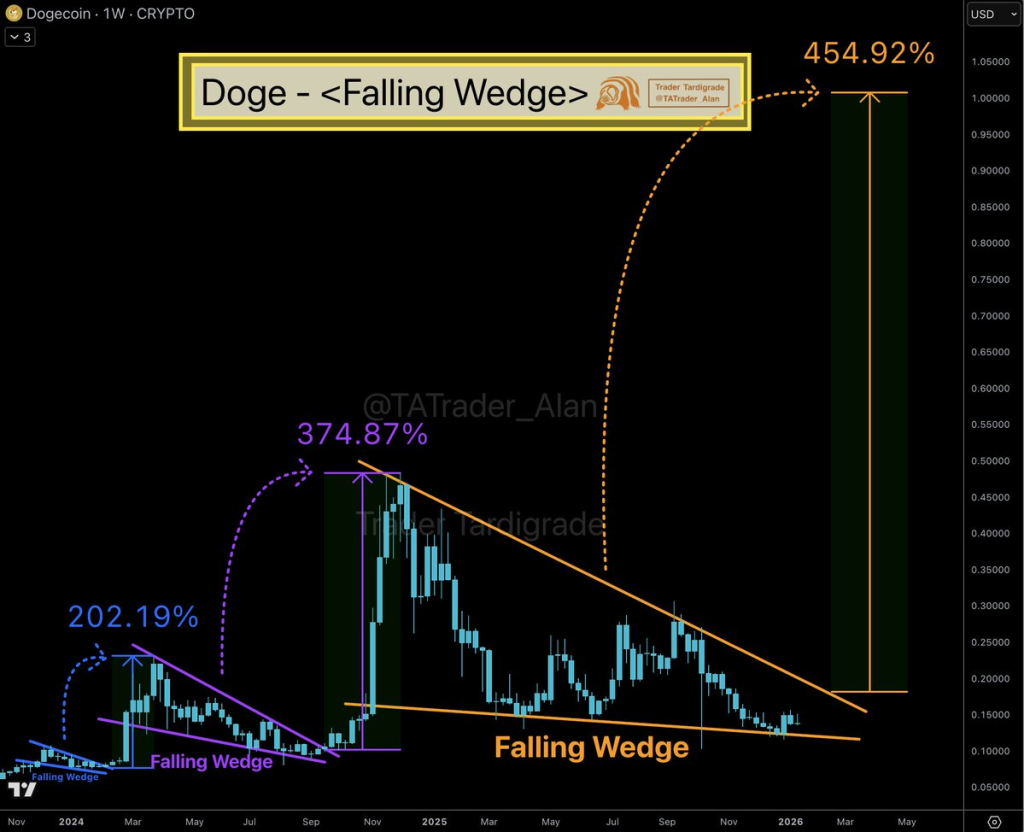
Dogecoin (DOGE) is currently forming its third falling wedge pattern on the weekly chart, a development noted by market analyst Trader Tardigrade. This specific chart pattern, characterized by lower highs and lower lows within converging trend lines, typically emerges during downtrends and is recognized for its potential to trigger sharp price movements upon a breakout.
Historically, Dogecoin has experienced significant rallies following similar patterns. In early 2024, the breakout from the first falling wedge led to gains exceeding 200%. Later in the year, a second wedge formation resulted in a substantial 374% price increase. Both instances saw periods of consolidation before buyers initiated upward price momentum. The current third wedge appears to be nearing its conclusion, with the price actively testing the resistance line.
Price Target Set Near $1
If Dogecoin's price action follows the trajectory of the previous two wedge breakouts, a projected 450% surge could propel its value towards the $1 mark. Technical analysis of the chart indicates a potential upward path that, if realized, would see the price rise from its current level to just above $1.
Trader Tardigrade has indicated that "a breakout from the 3rd falling wedge could lead to a 450% surge," emphasizing that this projection is based on the repetition of past patterns. However, it is crucial to note that no confirmation of a breakout has yet occurred, and the market remains susceptible to movements in either direction. Dogecoin's price is presently trading near the lower boundary of the wedge, a level closely monitored by traders.
Daily Chart Stochastic in Oversold Zone
On the daily chart, the Stochastic indicator has entered the oversold zone, a region often associated with potential price reversals or bounces. The last time DOGE's Stochastic indicator reached this level, the cryptocurrency experienced a subsequent price increase. Currently, both the blue and orange lines of the indicator are touching the lower boundary of the chart. The preceding movement from this oversold condition was followed by a notable short-term rally, leading traders to observe if a similar pattern will unfold again.
Current Price and Volume
As of the latest update, Dogecoin is trading at $0.1377. The cryptocurrency has seen a -0.02% change in value over the past 24 hours and a -1.6% decrease over the last seven days. The 24-hour trading volume is reported at $870,425,884, indicating sustained market interest despite the current period of lower volatility.
While historical data suggests the potential for significant gains following similar chart formations, future price movements will ultimately depend on how buyers respond to the wedge's resistance level. Until a definitive breakout is confirmed, Dogecoin's price is expected to remain within its current trading range.