

Key Insights
- •Dogecoin is testing the $0.14 support level, which has acted as a floor since March.
- •Short-term charts indicate early bullish momentum with a breakout and higher lows forming.
- •Price action is contained within a rising channel, with bulls maintaining support above the 21-period EMA.
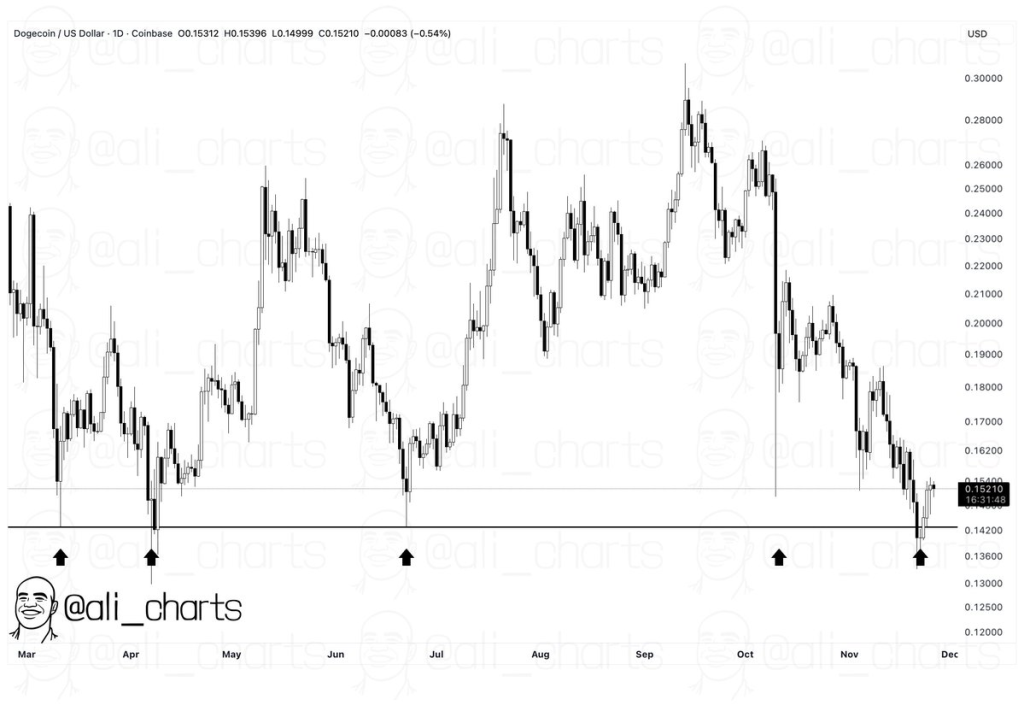
Dogecoin has approached the $0.14 mark for the fifth time since March, a support zone that has consistently served as a bottom during various sell-offs. On each prior occasion, the price either experienced a rebound or quickly recovered after brief dips below this level.
The most recent test saw the price move below $0.14 during intraday trading, but DOGE subsequently closed near $0.1499. This reaction suggests that buyers are still actively defending the level, although mounting pressure is a possibility. As one trader noted, "The more a level is tested, the more likely it is to fail," raising concerns about a potential breakdown.
Early Signs of a Shift on the 4-Hour Chart
Analysis of the short-term chart reveals that DOGE has broken above a descending trendline following the formation of an ascending triangle near its lows. This breakout was subsequently retested and held. Since that point, the price has established a pattern of higher highs and higher lows, which are often interpreted as early indicators of a new trend emerging.
This development signals an increase in buyer interest, particularly at lower price points. While this trend is not yet confirmed on higher timeframes, the short-term setup suggests a potential change in direction. Traders are now closely observing whether this structure can be sustained in the upcoming trading sessions.
Price Moves Inside Rising Channel
Another chart analysis indicates that DOGE is trading within a rising channel, with support being provided by the 21-period Exponential Moving Average (EMA), which is currently situated around $0.1476. The price continues to respect this level, thereby maintaining bullish pressure. The candlestick patterns remain within the boundaries of the channel, with higher lows underpinning the upward movement.
A measured move projection is also depicted on the chart. For this target to remain viable, the price must successfully break above the upper boundary of the channel. Conversely, if the price fails to maintain its current trajectory, a pullback towards support could occur.
Current Market Overview
Dogecoin was priced at $0.1499, reflecting a 0.8% increase over the preceding 24 hours. In the past week, DOGE has experienced a decline of 5.2%. The daily trading volume stands at $1.54 billion, indicating sustained activity around the $0.14 zone.
The market is currently at a critical juncture. A decisive breakout above short-term resistance could pave the way for further upward movement. However, a clear break below the $0.14 support level might signal a potential for lower prices.