

Key Market Observations
- •Doge develops its first daily bullish divergence as RSI forms a higher low during a fresh price dip.
- •Doge holds inside a narrow range with steady activity near the $0.156 support region.
- •Market shows weakening downside momentum as price continues forming lower lows on the daily chart.
Doge shows early momentum change on the daily timeframe as the chart prints its first bullish divergence of the current decline. Price continues moving inside a narrow range shaped by consistent trading activity and controlled volatility.
Bullish Divergence Appears on the Daily Structure
Doge begins with a clear bullish divergence noted on the daily chart. Trader Tardigrade observed that the latest candle created a lower low, while the RSI posted a higher low. This shift reflects weakening downside pressure within the broader trend.
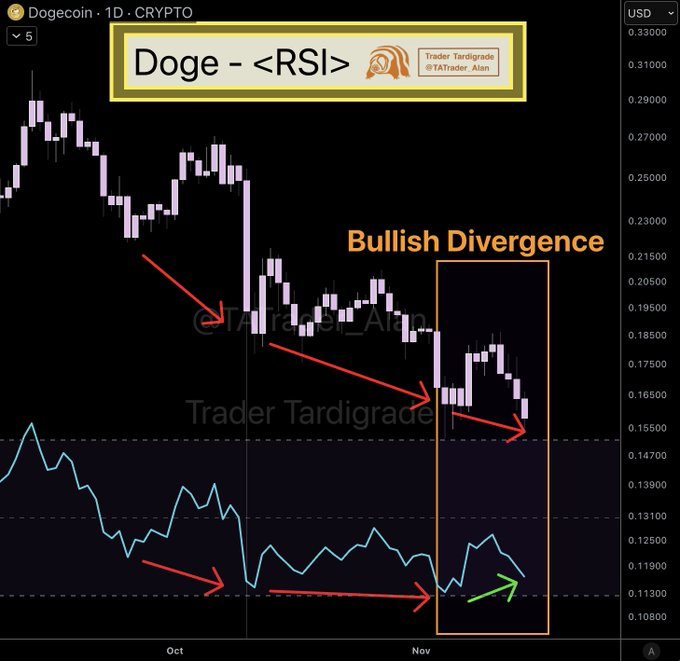
The divergence marks the first of this downtrend, giving the signal additional relevance. Doge followed a steady structure of lower highs and lower lows in recent weeks. Selling pressure remained present, yet momentum slowed enough for RSI to resist returning to its previous oversold zone.
The formation appears near an area that has drawn reactive buying in earlier sessions. While divergence alone is not a reversal cue, the separation between price and momentum often marks an early stage of trend exhaustion.
Doge Trades Within a Narrow and Controlled Band
Doge also shows a tight intraday zone with steady participation from both sides. Doge as of writing is trading at marginally lower than 1.4% at $0.1622, in a 24-hour range between $0.1561-$0.1645. This spread is an indication of a regulated market and not random fluctuations.
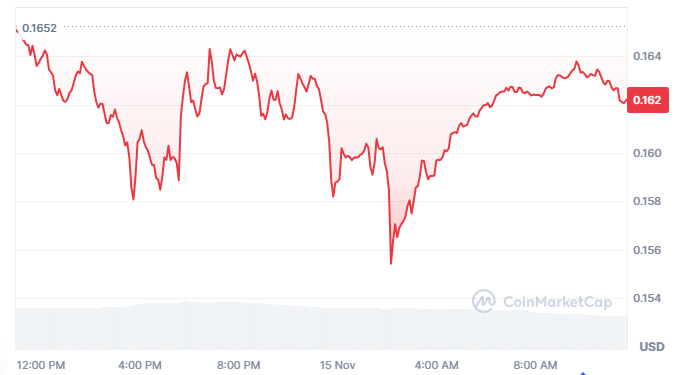
Doge is as of writing trading at a modest 1.4% low of $0.1622, in a day-long range between $0.1561 and $0.1645. This fluctuation proves a managed market and not a chaotic movement.
The coin has a market capitalization of approximately 24.63 billion and its supply in circulation is 151.75 billion tokens. Short-term traders and automated flows appear active, shaping the quick shifts recorded inside the observed window.
Support and Resistance Guide Near-Term Movement
Doge identifies two short-term levels directing the market. Buyers repeatedly reacted near $0.156–$0.157, forming a short-term demand zone that produced strong rebounds after each intraday drop. This behavior confirms stable interest around the lower boundary.
On the upper side the region of $0.164-$0.1645 was a temporary ceiling. Price approached this area multiple times but lacked sustained momentum to push above it. The repeated tests helped define the soft range that governed recent sessions.
As the chart extended, the slope shifted slightly upward, showing buyers absorbing pressure at a steady pace. With the first bullish divergence now present, traders await a clearer directional signal once broader momentum strengthens.