

The current market conditions suggest a lack of immediate recovery potential. The prevailing investor sentiment and suppressed volatility create a scenario where a bearish continuation is plausible.
Ethereum's Local Resistance Being Scorched
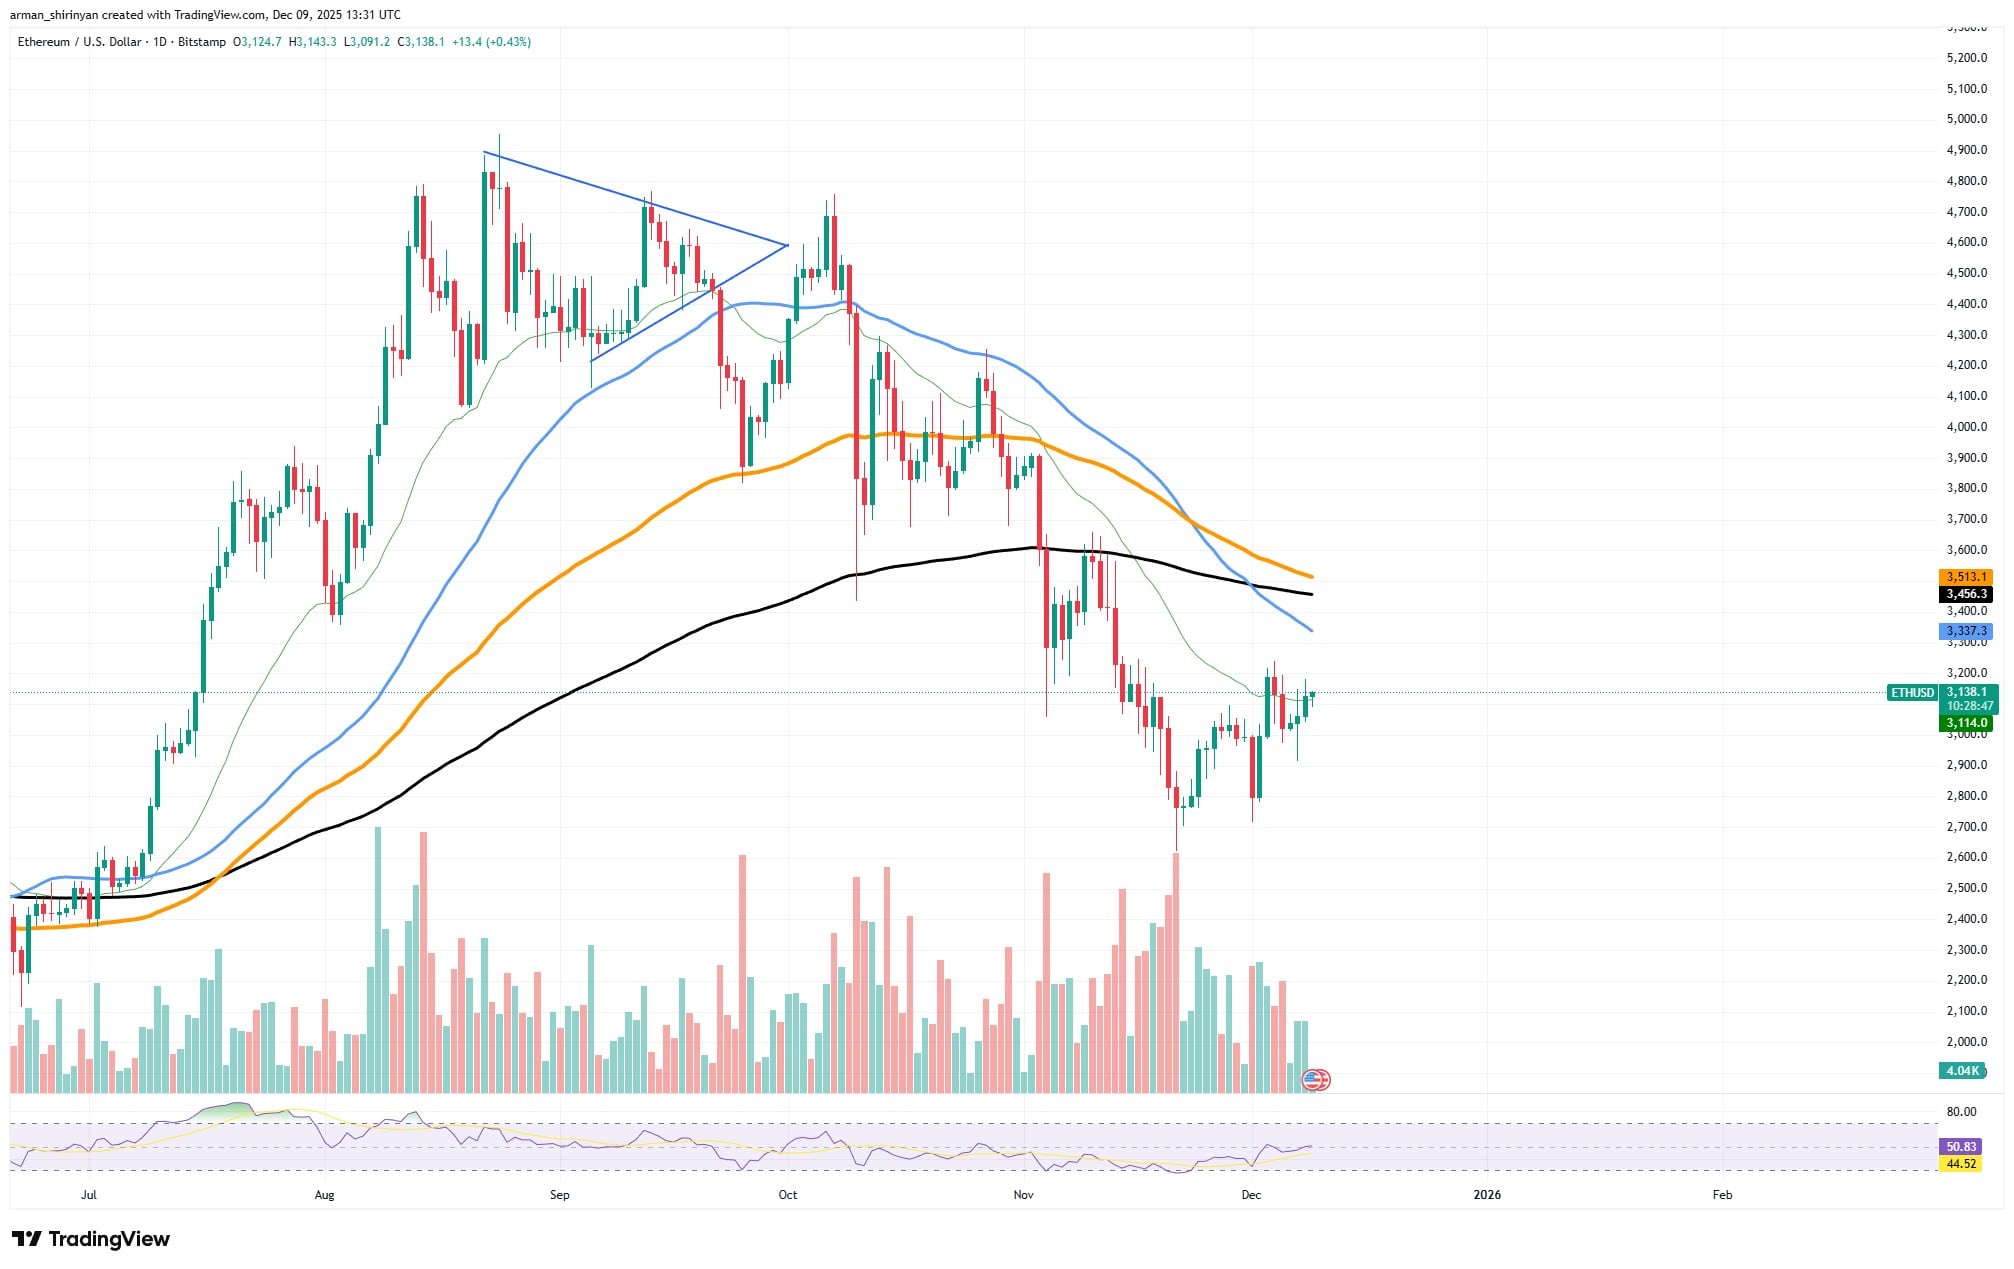
Ethereum is approaching a significant cluster of resistance on its chart, and the market's reaction here will be crucial in determining the direction for the coming weeks. The recent rally from the $2,700 level was characterized by strong momentum and a notable increase in buying pressure, rather than a weak bounce. The price is currently pressing directly against a confluence of short-term moving averages, and the level of bullish sentiment surrounding ETH is becoming increasingly difficult to disregard.
Over the past two weeks, ETH has consistently printed higher lows, demonstrating a structural recovery that often precedes more substantial trend reversals. The Relative Strength Index (RSI) has moved above the midpoint and is now within the 50-55 range, indicating a return to strength without entering an exhaustion zone. Furthermore, volume has remained elevated during periods of price increase, a behavior not observed during the sell-off in October when buyer participation was minimal. Buyers are now intervening early and with considerable force.
This enthusiasm is not limited to retail investors. Data on capital inflows across various markets indicates that investors are reallocating funds into ETH at an increasing rate. The broader shift in sentiment, evident in spot accumulation, custody flows, and derivatives positioning, suggests that the market is anticipating more than just a temporary recovery. Investors are increasingly viewing dips as opportunities rather than causes for caution.
ETH is currently facing resistance from the 50-day and 100-day moving averages. This cluster forms a strong resistance area between $3,250 and $3,350. ETH is effectively "scorching" this resistance by repeatedly pushing into it and refraining from making significant retreats. Assets that exhibit such behavior are typically poised for a breakthrough rather than a decline.
Should ETH break through this zone with a strong daily close, the path toward the 200-day moving average and ultimately the mid-$3,700s would open up swiftly. The current wave of bullish conviction and ongoing inflows could form the foundation for a broader recovery leg.
Shiba Inu's Strong Divergence
Shiba Inu is exhibiting one of the most apparent momentum divergences on its chart in recent months. Following a prolonged decline, the price has been consolidating sideways, but the volume has decreased much more rapidly than the price. This disconnect results in a classic bullish divergence: sellers are still pushing SHIB lower, but with significantly less force. This is often the initial indication that downside pressure is exhausting in such markets.
The 50-day, 100-day, and 200-day moving averages are all aligned overhead in a bearish configuration, and SHIB remains below several significant moving averages on its chart. This indicates that the overall trend has not yet changed. However, the manner in which prices are interacting with these averages is evolving. Instead of cascading lower, the asset has begun to form a series of higher lows as volatility decreases. This is how the market subtly signals the end of an aggressive liquidation phase.
Volume is a critical factor. Every downward movement in October and early November was accompanied by substantial sell-side volume. Now, the volume barely changes when SHIB experiences a price drop. The pattern of sellers stepping in has altered. On the few green days, which show slightly higher volume than red days, a small but significant shift in order flow is evident, frequently preceding a base-building phase.
While this divergence does not guarantee immediate profits, it sets the stage for them. A breakout attempt becomes more probable when price compresses and volume diminishes, as it requires less capital to move the market. When combined with a rising RSI that is stabilizing in the mid-40s, SHIB appears more balanced than bearish.
XRP's Structural Shift
The chart for XRP is finally displaying structural indicators of a slowing downtrend, and the evidence is compelling. For months, the asset has traded within a clearly defined downward price channel, consistently printing lower highs and lower lows.
However, the most recent price action deviates significantly from this pattern: buyers are intervening earlier and with greater consistency, and sellers are no longer capable of forcing new lows. After multiple tests of the channel's lower boundary, XRP is beginning to hold higher lows instead of continuing its clean downward trajectory. This development alone suggests that bearish pressure is diminishing, but the signs do not end there.
The RSI has stabilized in the mid-40s after spending months below this range. This is a typical early momentum shift that often occurs before the conclusion of a trending decline. The market is slowly but steadily recovering and is no longer in oversold territory. Volume data supports this observation.
Although not exceptionally explosive, the volume on green candles now exceeds the sales spikes that characterized October and early November. This change in order flow indicates that buyers are subtly regaining control in markets where bears previously dictated every move.
Perhaps the strongest indication that the downtrend is nearing its end is how XRP is currently interacting with the mid-channel region. Instead of being forcefully pushed back, the price is consolidating directly beneath the declining resistance line. Assets poised for a breakout frequently exhibit this behavior, whereas assets preparing for further downside rarely do. A break by XRP from the upper boundary of the descending channel, even with moderate volume, is likely to be interpreted by the market as a trend inflection.
Should such a move occur, the 50-day moving average at $2.27 would be followed by heavier resistance zones at $2.40 and $2.47.