

Crypto markets may be entering a recovery phase, according to new insights from Coinbase Institutional. The firm believes December could mark a turning point as liquidity improves, rate-cut expectations surge, and macro conditions begin to tilt in favor of risk assets again.
Coinbase points to three elements now aligning: a rebound in global liquidity, renewed appetite for AI-linked equities that has not yet cooled, and growing attractiveness in short-USD positioning. Together, these factors are creating what Coinbase calls a setup for a broader market reset.
The exchange highlights that this shift has been building since October, when its teams first flagged weakening momentum heading into November followed by a potential reversal in December. That forecast appears to be playing out, with sentiment now stabilizing and early signs of renewed demand showing across several risk-asset classes.
Liquidity Returns as Fed Expectations Shift Sharply
One of the strongest signals comes from monetary expectations: the probability of a Federal Reserve rate cut has jumped to 92% as of December 4. Lower rates typically support higher-beta assets, especially crypto, as liquidity expands and borrowing conditions loosen.
Coinbase notes that the so-called “AI bubble” still shows no meaningful signs of exhaustion, which is indirectly supportive of crypto since both sectors benefit from similar liquidity conditions. Meanwhile, short-dollar trades are becoming increasingly favorable, adding another macro tailwind for digital assets.
A Repricing That Could Mark the Start of New Momentum
Coinbase frames the current environment as the potential “starting line” for crypto momentum to reassert itself after weeks of consolidation. If liquidity follows the path implied by the firm’s custom M2 index, the market may be positioned for a broader recovery phase as Q4 progresses into early 2026.
The messaging emphasizes a clear shift from caution to cautious optimism: macro headwinds that dominated earlier in Q4 appear to be easing, opening the door for crypto markets to regain strength.
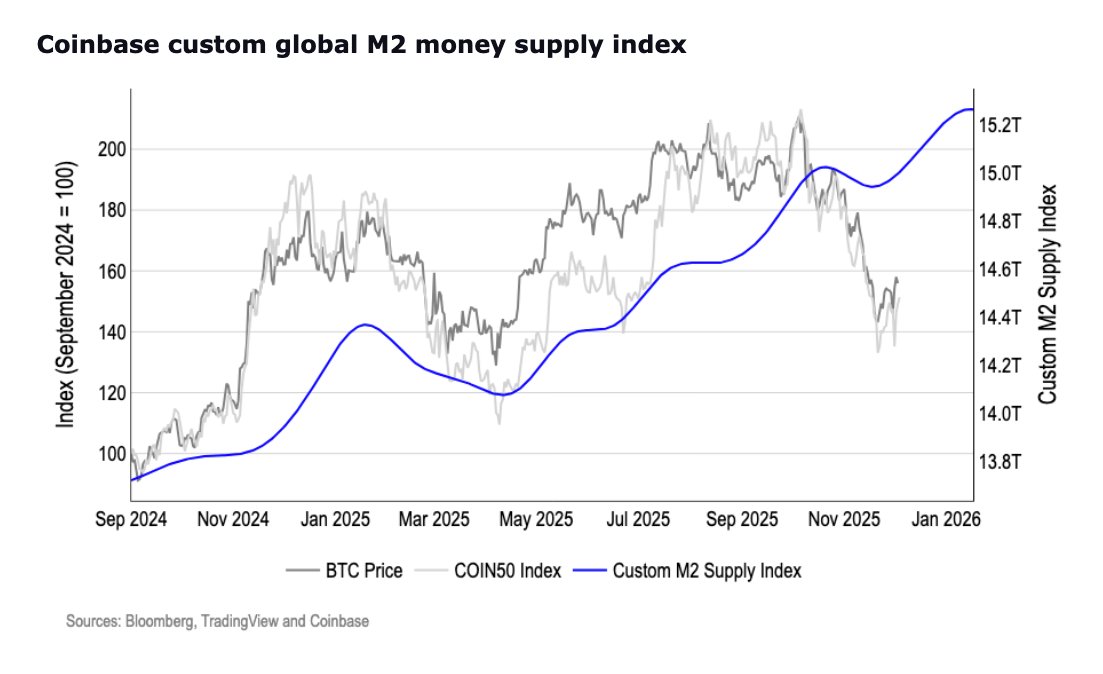
Chart Breakdown: Coinbase’s Custom Global M2 Index Signals a Turn
The chart shows three primary data lines:
- •BTC Price (grey)
- •COIN50 Index (light grey)
- •Custom M2 Supply Index (blue)
The blue M2 curve is the key indicator. Here’s what it reveals:
- •After a softening period through mid-2025, the index bottomed out in late summer.
- •Since then, it has turned sharply upward, approaching 15.2T on the right axis, its highest level heading into 2026.
- •Historically, BTC has reacted strongly to expansions in global liquidity. The chart visually shows past correlations where upward M2 movements preceded Bitcoin price recoveries.
Meanwhile, the BTC price line shows a clear decline from its mid-2025 peaks, followed by a stabilization pattern that aligns with the rebound in the M2 curve. This is exactly the type of liquidity setup Coinbase is referencing, a macro turn that may allow BTC to catch up to improving monetary conditions.
In short, the chart reinforces Coinbase’s thesis: global liquidity appears to be re-accelerating, and Bitcoin has historically responded with delayed but strong upward cycles when this happens.