

Current Market Performance and Standing
Cardano (ADA) is currently trading near the $0.39 mark, having experienced a decline of just over 3% in the past 24 hours. The cryptocurrency has traded within a narrow range this week, showing a gain of less than 1%. ADA maintains its position as the 12th largest cryptocurrency, boasting a market capitalization exceeding $14.4 billion and a circulating supply of 37 billion ADA. Despite mixed market sentiment, recent chart formations are capturing the attention of analysts.
Analyst Insights: Potential for a Downward Correction
Analysis from "Man of Bitcoin" suggests that ADA might still be undergoing a corrective phase. Based on a shared wave count, the initial wave appears to have concluded, and the current price movement could be part of a larger wave (2) correction. The asset is trading below the critical $0.438 level, identified by the analyst as a key resistance point.
“As long as the price stays below $0.438, my preference is a larger ABC correction in wave-(2),” the analyst stated.
If this projection proves accurate, the next price movement could lead to a decline, potentially targeting the support zone between $0.379 and $0.345. While these levels may offer some buying interest, a break below them would indicate a weakening of the short-term price structure.
On the weekly chart, ADA continues to trade within the confines of a symmetrical triangle pattern. The lower support trendline, situated around $0.39, has been tested multiple times without a decisive breach. The upper trendline remains unchallenged, contributing to a tight and indecisive market structure.
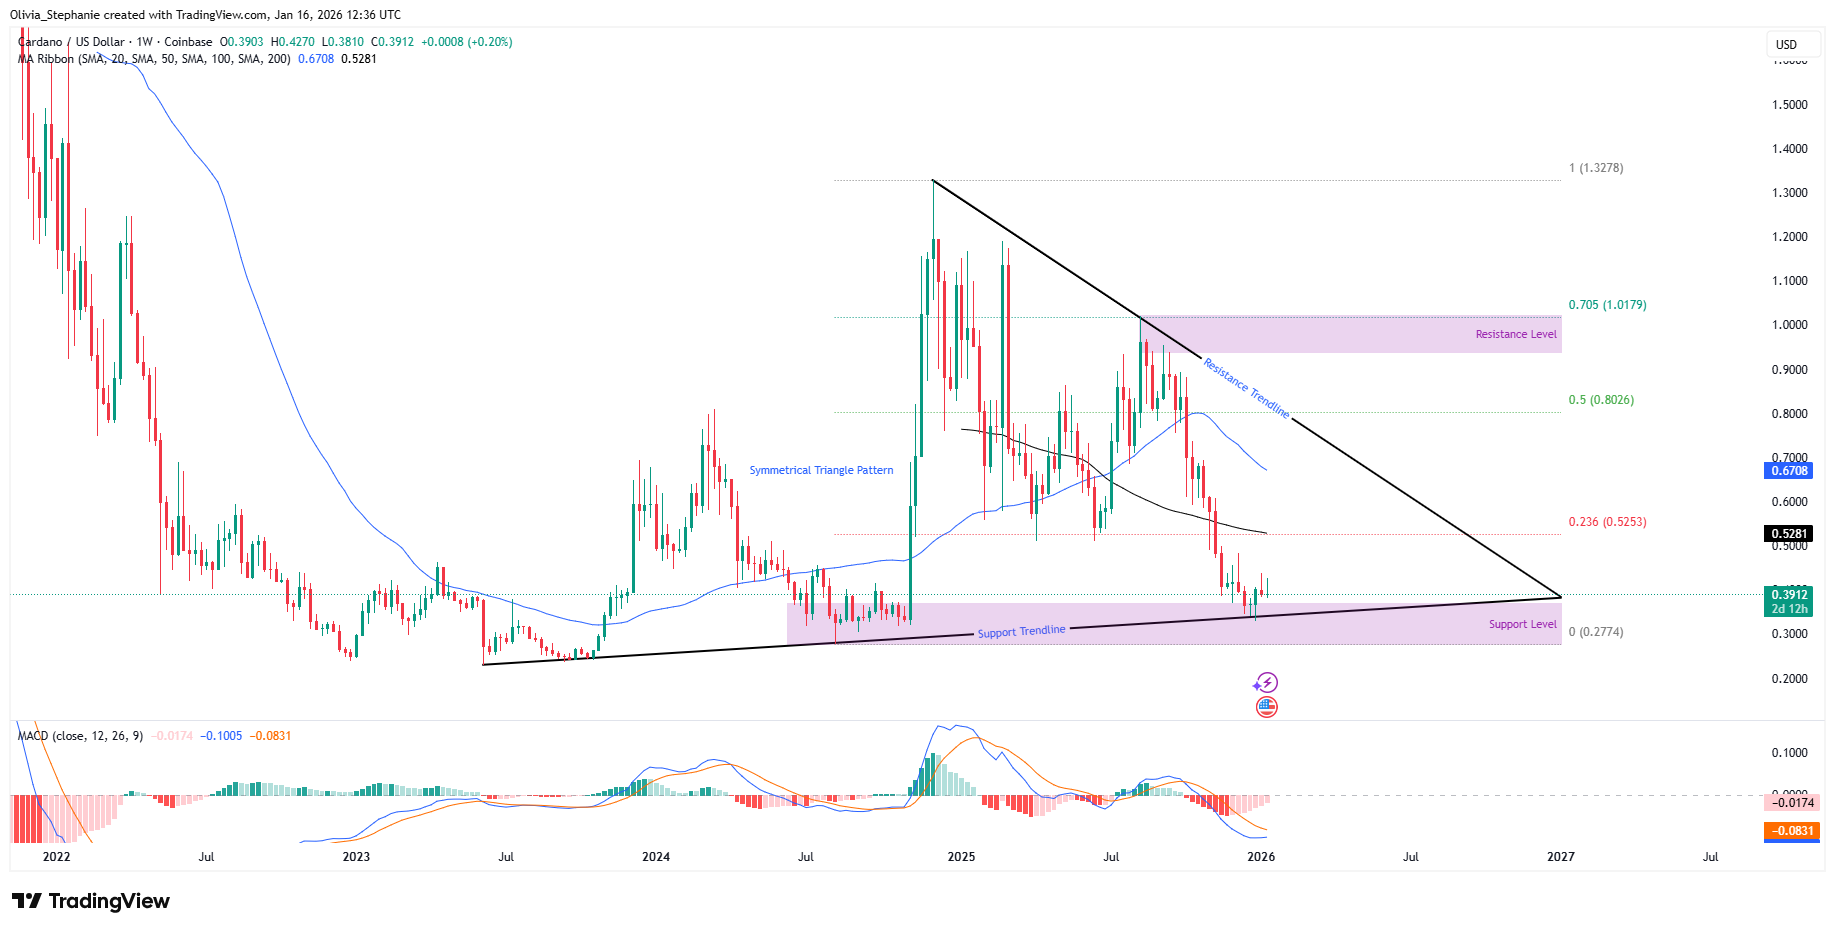
The price action remains below key moving averages, suggesting a cautious broader trend. The Moving Average Convergence Divergence (MACD) indicator also points to weak momentum, with the signal line positioned above the MACD line and the continued presence of red histogram bars. While sellers are currently active, the selling pressure has not significantly intensified.
Emerging Bullish Pattern Under Resistance
Concurrently, a cup-and-handle pattern is developing on lower timeframes, according to analyst Ali Martinez. This pattern is generally considered bullish if it is confirmed by a subsequent price breakout. The neckline for this pattern is established around $0.423. A confirmed break above this resistance level could potentially propel the price towards the $0.517 target. The handle portion of the pattern is currently forming within the price range of $0.387 to $0.404.
Cardano $ADA could be forming a cup-and-handle.
A break above $0.423 could open the door to $0.517. pic.twitter.com/A0YldAVGzE
— Ali Charts (@alicharts) January 15, 2026
This specific pattern and its resemblance to historical formations have preceded rallies in other market assets. The cup-and-handle pattern remains technically valid as long as the price maintains support above the handle's trading range.
Despite the recent price dip, on-chain data indicates a reduction in selling pressure. Exchange flows show a trend of ADA being moved off trading platforms, which is often interpreted as a sign of increased investor confidence. Data from CoinMarketCap also positions ADA favorably among cryptocurrencies rated highly by community sentiment.
In related developments, CME Group is preparing to list ADA futures, with trading slated to commence on February 9, subject to regulatory approval. This move would place Cardano alongside other prominent altcoins already available in U.S. derivatives markets.