

Key Insights
- •BNB has lost its 200-day SMA, indicating a confirmed bearish structure shift and downside pressure.
- •The price dropped 27% after rejecting the $1020 level, with the next key support zones identified at $730 and $600.
- •While the RSI shows oversold conditions, there are no strong reversal signs, and bearish momentum continues to dominate.
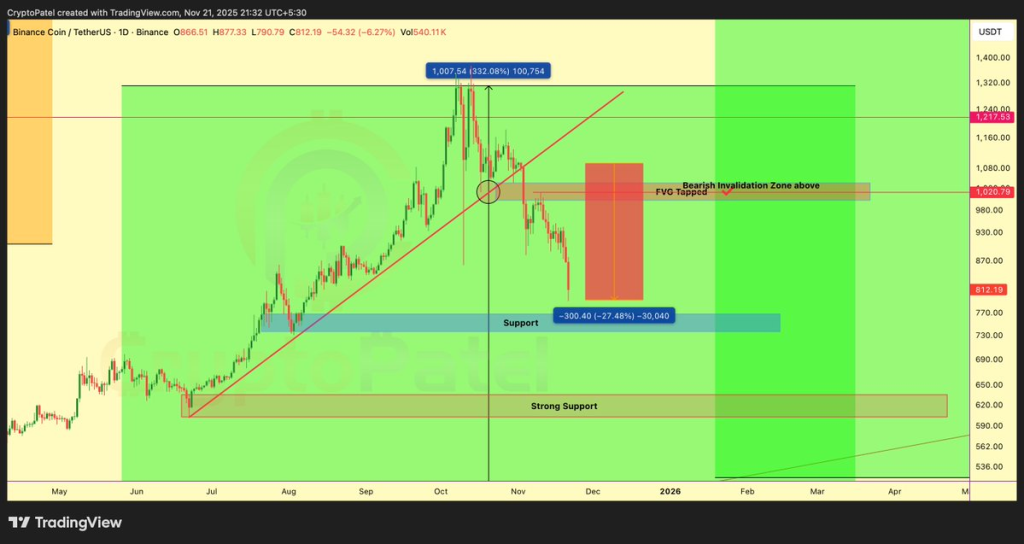
Binance Coin (BNB) experienced a significant drop of 27% after failing to maintain support at the $1,080 level. This breakdown occurred following a rejection near the $1,020 fair value gap, which also served as the bearish invalidation zone. The price is currently trading near $816, firmly within a downward price structure.
The recent decline is consistent with a clear trend break. The uptrend line that had supported the rally since mid-year has now been breached. A red zone on charts highlights this decline, with the next significant support levels observed near $730 and $600. These areas are now critical reference points for traders monitoring for potential demand zones.
200-Day SMA Break Confirms Structural Shift
BNB has also fallen below its 200-day Simple Moving Average (SMA), which was located around $843. This moving average had provided trend support for several months. The current price action shows no signs of recovery above this level, signaling a loss of structural strength.
“That’s not a ‘maybe bearish’ situation, that’s a confirmed loss of a major structural level.”
Without a sustained close above this key moving average, the bearish trend is expected to remain in control. Trading volume has increased during the recent price drop, further reinforcing the bearish momentum.
No Strong Bounce Signals Yet
The Relative Strength Index (RSI) on the daily chart has fallen below the 30 mark, currently standing near 27. While this indicates oversold conditions, the market has not yet shown a strong buying response. Minor bullish divergences are observable on lower timeframes, but these have not been sufficient to alter the prevailing trend.
According to CryptoPatel, "The structure still looks bearish until price regains $1020 with strong volume and an HTF close above it." Until such conditions are met, any upward price movements are likely to be viewed as reactions rather than definitive reversals. The price range between $725 and $600 is now considered a zone to monitor for potential buyer interest.
Larger Outlook Still Intact
Despite the sharp pullback, some market observers maintain a positive long-term outlook. Patel commented that "the path to $2,000–$3,000 is still wide open," although he also acknowledged the possibility of further short-term weakness. At the time of writing, BNB's price was $816.13, reflecting a 7.0% decrease in the past 24 hours and an 11.4% decline over the last week. Trading volume remains high, with over $4.5 billion exchanged in the last 24 hours. The market sentiment remains cautious, with clear signs of recovery yet to emerge.