
General Evaluation
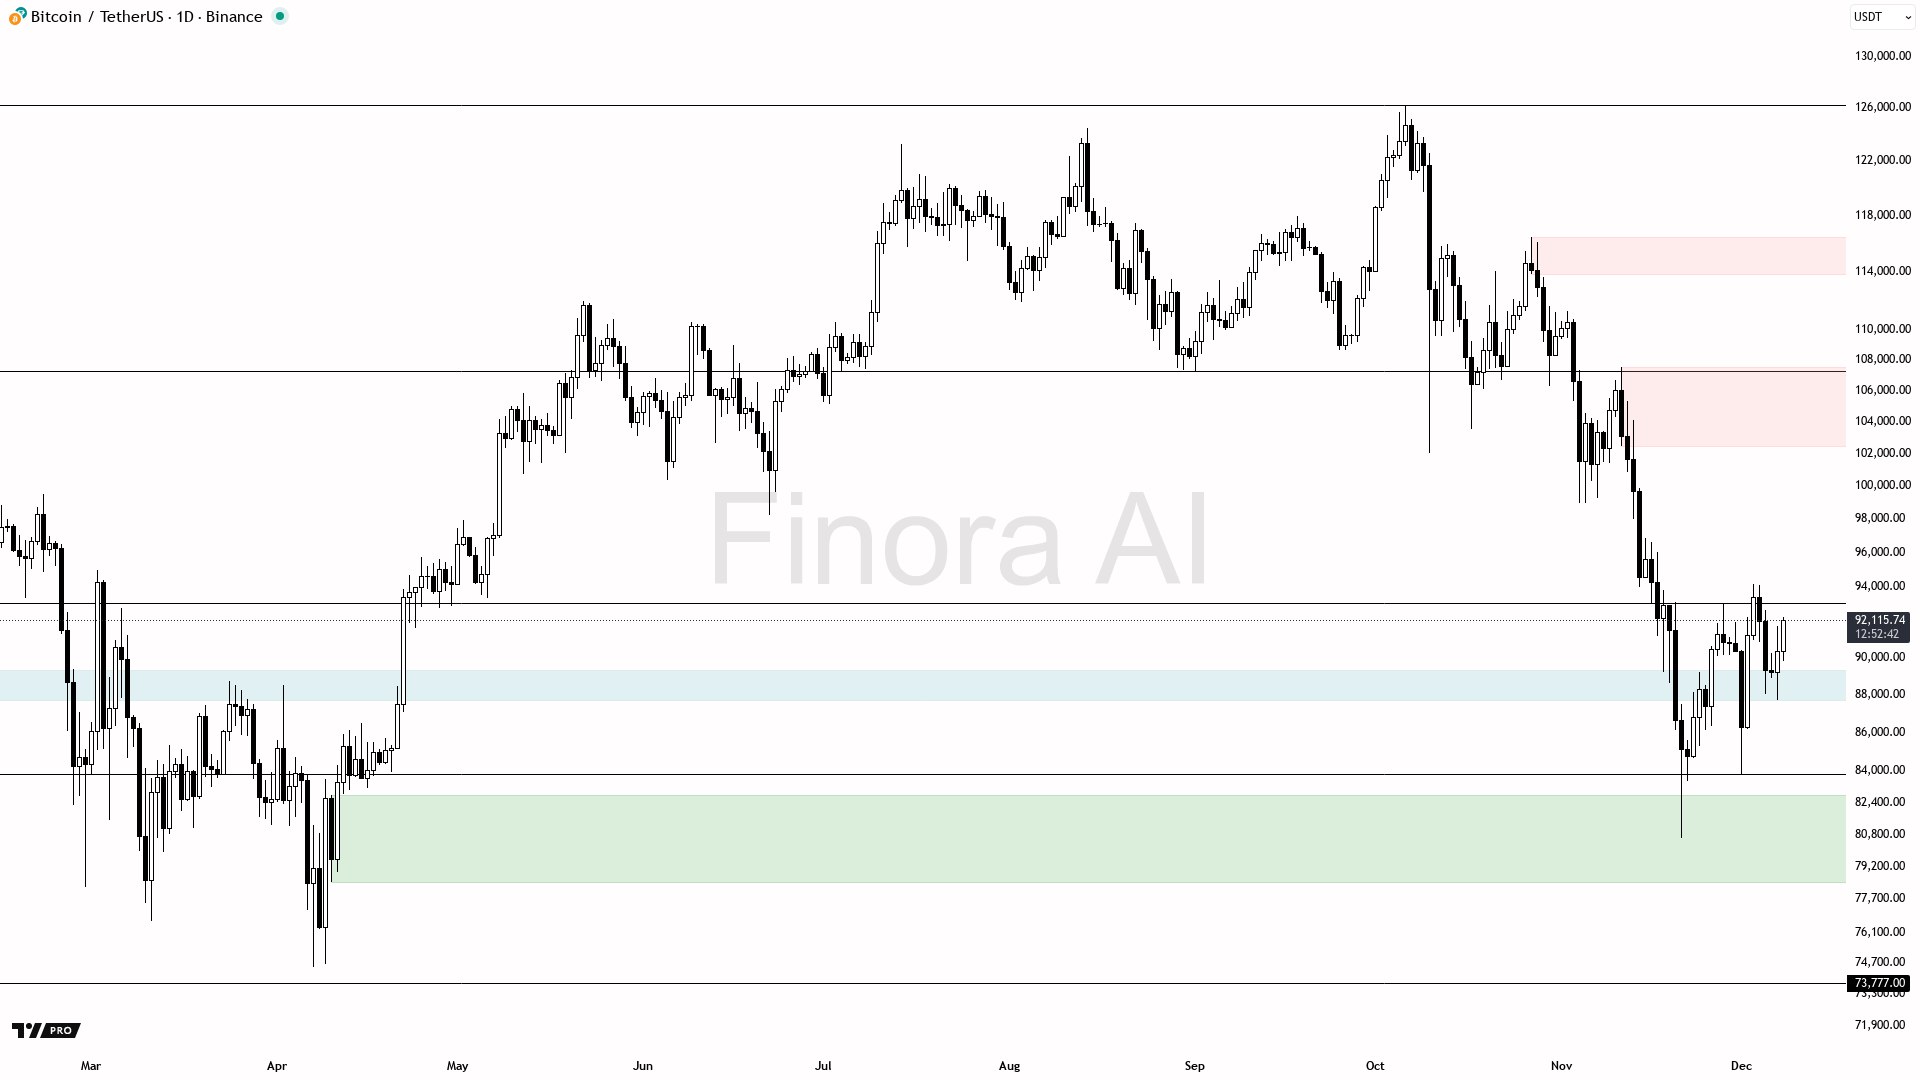
The current price is approximately 92,067 USDT. The most recent high of the last major swing was at 111,250, and the most recent low was at 80,600. The equilibrium level of this swing is at 95,925. The trend is currently described as bearish, but recent daily action is showing some bullish momentum. Many key indicators, including MACD, Stochastic, Vortex, Momentum, RSI, and PSAR, are turning bullish, while DMI, MFI, and Fisher remain bearish. The price is hovering below the equilibrium of the last big swing and just above the most recent low—this zone is often where smart money looks for liquidity grabs and potential reversals. The price is still below the 200 Exponential Moving Average (EMA), indicating the macro structure remains bearish, but it is above the 20 EMA, suggesting a possible short-term shift.
Critical Levels
The closest support levels below the current price are 91,542, 90,065, 88,995, 83,822, and 80,600 (the most recent swing low). The closest resistance levels above the current price are 94,150, 102,000, 108,020 (a significant supply and inefficiency area), and 116,400 (major supply). There is a bearish imbalance area just above the current price, around 96,300, and a larger one at 108,020; these could act as magnets if the price pushes higher. Demand interest is present at 80,600 and 74,508, which are likely reload spots for deeper dips. The current price is sandwiched between multiple support zones with liquidity likely building below.
Trade Ideas
The price has reclaimed some support and is showing bullish signs on many indicators, but it remains in a bearish macro structure. For traders looking for a short trade, a good setup would be to wait for the price to push into the 94,150–96,300 zone and demonstrate reversal patterns, such as a pin bar or engulfing candle on the daily chart, or a lower timeframe momentum breakdown. For a long setup, traders should watch for a liquidity sweep below 90,065 towards 88,995 or even 83,822. If a sharp rejection and a bullish reversal candle are observed, this would signal an entry for a long position, targeting the 94,150 and 102,000 levels. For both scenarios, confirmation could be a bullish/bearish engulfing pattern, strong pin bars, or a market structure break on the 4-hour or 1-hour charts.
Expectation
The price is expected to make a move toward the 94,150–96,300 resistance area first. If a clean rejection is observed in that area, the price could reverse and attempt to revisit 91,500, 90,000, or even sweep the lows toward 88,995 or 83,822, where liquidity and demand are stacked. A potential trade setup involves waiting for the price to sweep below 90,000 and leave a bullish pin bar or engulfing candle; at that point, a long entry could be considered with targets at 94,150 and 102,000. The stop-loss should be placed at the swing low just below the entry. Conversely, if the price pushes into the 94,150–96,300 resistance and forms a strong bearish reversal, such as a daily engulfing or a clear rejection with high volume, a short setup could be considered, targeting 91,500 and 90,000. The stop-loss would be placed above the swing high in that area. Confirmation is crucial for both scenarios: for longs, look for a bullish engulfing pin bar or a rapid reclaim; for shorts, look for a bearish engulfing or a strong rejection candle.