

Bitcoin’s long-term chart and CoinGecko’s Thanksgiving price history together create a clear picture of how dramatically the asset has expanded over the past decade. Even with recent volatility pulling the price away from its all-time high, the broader trend visible in your chart shows a market that continues to mature, climb, and reset at progressively higher floors.
The historical price list illustrates the scale of this transformation. In 2015, Bitcoin traded at just $323 on Thanksgiving Day, barely registering on the chart’s far-left side. The following years show a steady progression toward higher levels, with $740 in 2016 and a sharp breakout to $8,100 in 2017. The pullback in 2018, down to $4,300, is clearly visible on the chart as a temporary correction before the market began rebuilding momentum.
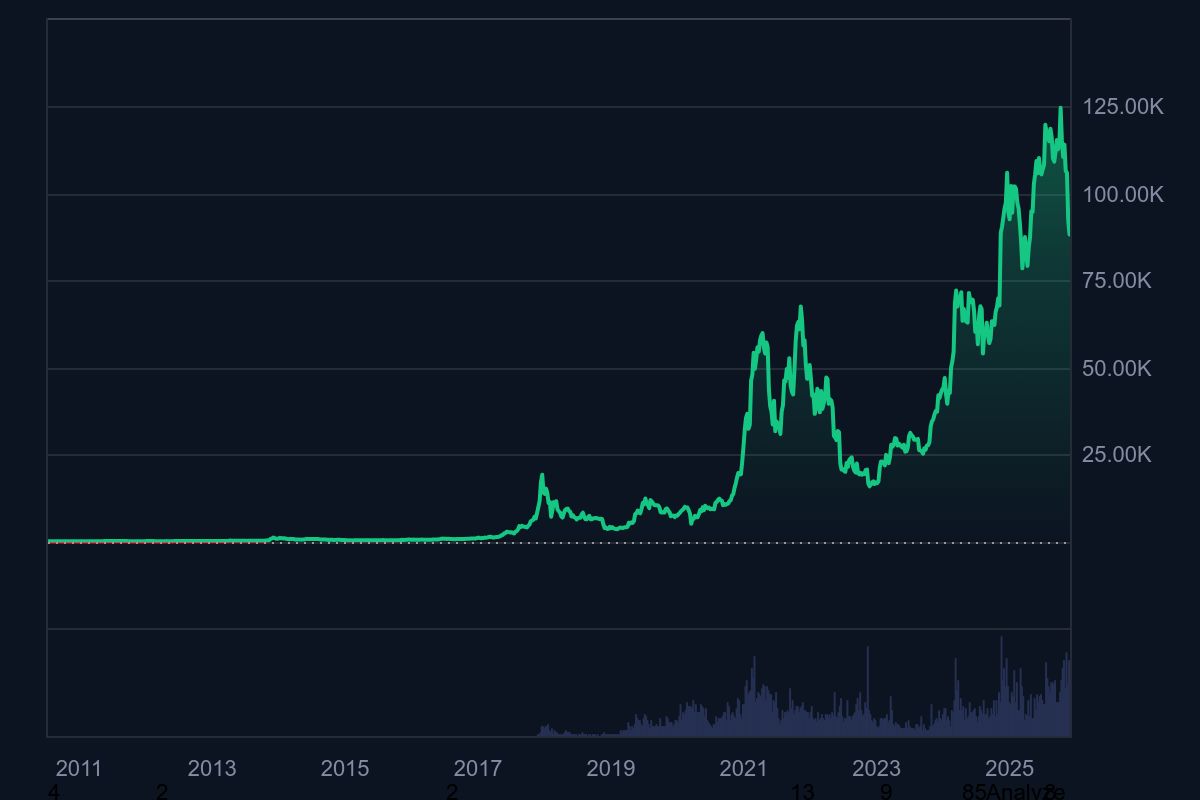
By 2019, the Thanksgiving price rose to $7,290, followed by a major leap to $18,390 in 2020. The long-term chart reflects this shift as Bitcoin began forming a larger structure of higher highs and higher lows. The surge to $56,380 in 2021 stands out as one of the steepest climbs on the graph, marking a defining moment when Bitcoin transitioned from a speculative asset into a macro-scale market instrument.
The drop to $16,172 in 2022 shows up on your chart as a deep cyclical reset, yet it is clear that even this “low” was significantly higher than all previous market bottoms.
The recovery that follows, $37,460 in 2023, positions Bitcoin back on its upward trajectory, with the long-term graph showing renewed accumulation and expanding trading volume.
The acceleration into 2024, when Bitcoin reached $95,950 on Thanksgiving, matches the steep upward curve visible on the right side of your chart. Even though 2025’s Thanksgiving price of $91,570 is slightly below the previous year, the chart confirms that Bitcoin remains near the upper boundary of its historical performance. The most recent price action forms a pattern consistent with consolidation at high levels rather than any structural breakdown.
Market Evolution and Long-Term Outlook
Across the entire timeline, the chart shows a market that has redefined what its “normal range” looks like. What once counted as an all-time high is now barely visible compared to the towering peaks of the past two years. Volatility remains part of Bitcoin’s identity, but the trend of long-term expansion is unmistakable, every pullback forms a higher base, and every cycle pushes the ceiling upward.
Together, the visual and historical data you provided show a decade where Bitcoin moved from being an experimental digital token to a globally recognized store of value, rising from a few hundred dollars to over $90,000 during the same holiday benchmark. Even with periodic corrections, the long-term structure highlights an asset still operating in an elevated growth phase, supported by increasingly higher adoption and a dramatically stronger market foundation than in any previous cycle.