

In Brief
- •Technical analysis indicates the market is consolidating after a bullish breakout, maintaining a positive structure despite weakened short-term momentum.
- •Prices are fluctuating between major defense zones and key resistances, suggesting potential volatility upon breakout.
- •Market sentiment has shifted to fear, reflecting reduced investor confidence and a more cautious approach.
- •Derivatives indicators suggest an orderly and balanced market, without excessive leverage or pronounced directional pressure.
- •The outlook remains conditional, with the bullish structure preserved as long as key support levels hold.
BTC/USD Technical Analysis
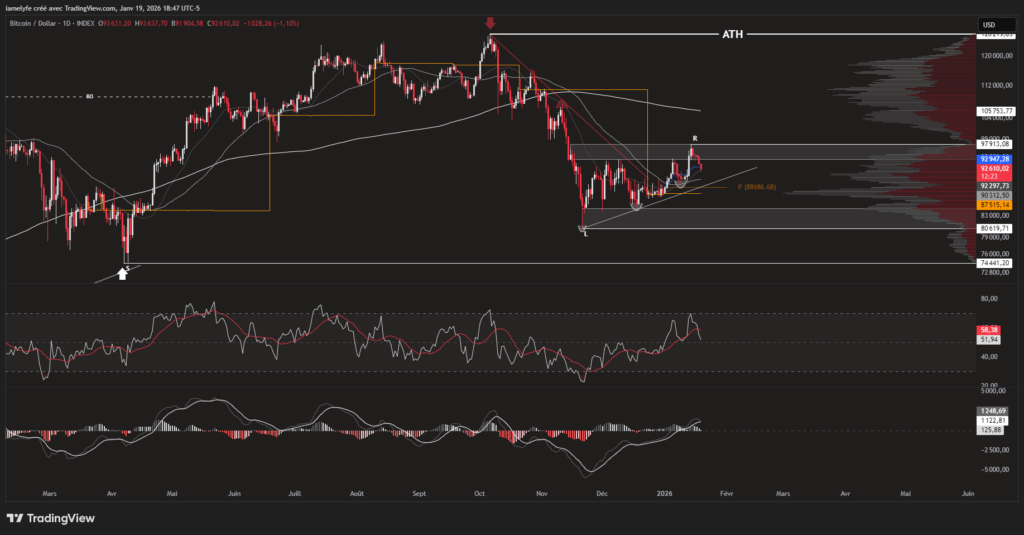
Bitcoin is currently trading around $93,000, showing a weekly increase of approximately 3%. This movement follows a technical retracement after a bullish breakout from a range, indicating a digestion phase of the prior move rather than a trend reversal. Weekly spot volumes have risen to about $25.5 billion, a 14% increase, signifying moderate growth in participation without speculative excesses.
The long-term trend remains distinctly bullish, supported by a positively oriented 200-period moving average. Mid-term momentum has neutralized following a pullback phase, pointing to progressive market stabilization. The short-term trend is turning bullish again, suggesting an attempted recovery after the recent retracement. Momentum indicators show a technical rebound; oscillators, after a substantial decline, are signaling a resumption of momentum, although this remains fragile and requires confirmation to be sustained.
Bitcoin (BTC) Technical Levels
Bitcoin is currently positioned below several significant resistances: $97,913, $107,461, and $116,400, with the all-time high at $126,219 above these. These levels are critical zones that could act as distribution points if buying pressure wanes. On the downside, identified supports at $89,226, $83,496, and $80,619 represent major defensive levels historically associated with accumulation phases.
The recent daily breakout above $95,000 signifies crossing a resistance that corresponds to the upper boundary of a range established in November 2025, thereby reinforcing the validity of the underlying bullish structure. The monthly pivot point at $88,686 remains below the current price and continues to serve as a key reference for monthly momentum. The volume profile highlights a high-value area around $111,000 and a low-value area at $87,551, defining a market balance whose breakout could accelerate directional movement.
Market Sentiment
Market sentiment is currently at the fear threshold, indicating pessimistic confidence and increased caution among investors. This deterioration in sentiment occurs despite a still constructive technical structure, highlighting a divergence between perception and price momentum. Net flows into Bitcoin spot ETFs are generally balanced, suggesting institutional players are adopting a reactive stance, following price movements rather than driving the current trend.
The current technical analysis was conducted in collaboration with Elyfe, investors and market educators on cryptocurrencies.
Derivatives Analysis (BTC/USDT)
Derivatives indicators depict a generally stable and orderly market. Open interest remains stable, indicating measured speculative positioning and no directional overcommitment. CVD flows are balanced, though a slight selling dominance is observed, reflecting moderate pressure without significant imbalance. Liquidations remain low and unbiased, confirming a healthy market environment without major forced exits. The funding rate, slightly positive, indicates a moderate predominance of long positions without leverage excess.
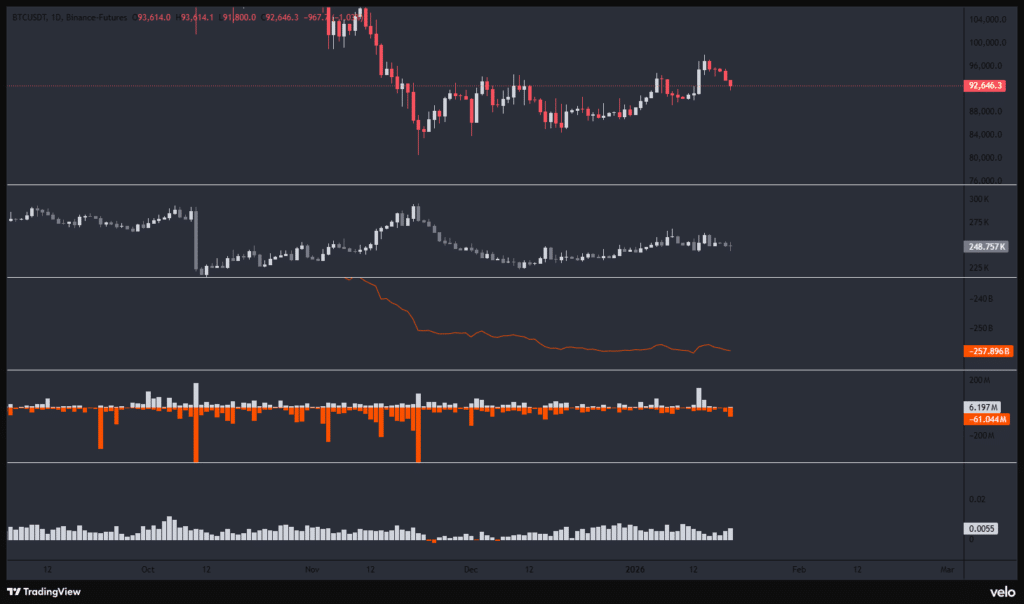
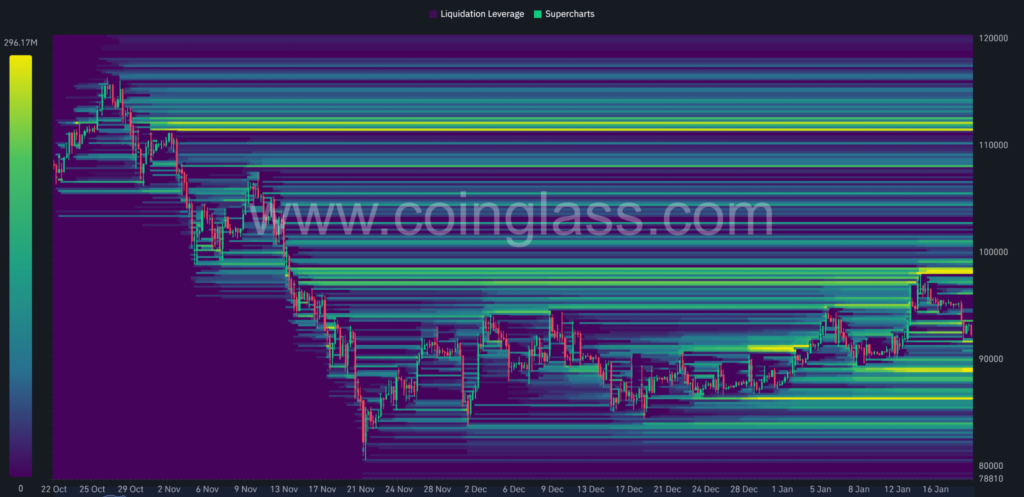
The selling liquidation zone between $98,290 and $112,634 represents a critical threshold. A breakout could strengthen bullish momentum, but it could also serve as a distribution zone if the market loses strength. Conversely, the buying zone between $84,000 and $89,000 remains vulnerable to a breakdown, potentially triggering bearish acceleration, while also representing a potential point of interest for strategic accumulation.
Bitcoin (BTC) Price Forecasts
Bullish Scenario
- •Conditions: Price remains above $89,226.
- •Targets: $97,913, then $107,461, and $116,400.
- •Potential: Approximately a 25% increase from the current level.
Bearish Scenario
- •Conditions: Breakdown of support at $89,226.
- •Targets: $83,496, then $80,619.
- •Potential: Approximately a 13% decrease from the current level.
Bitcoin is currently in a consolidation phase following a bullish breakout. The underlying structure remains positive, though market sentiment has weakened. Derivatives indicators suggest a balanced environment without speculative excess, while technical levels are tightly defining price action. In this context, closely monitoring price reactions at strategic levels will be essential to confirm or adjust current forecasts. It is important to remember that these analyses are based solely on technical criteria, and cryptocurrency prices can change rapidly due to other, more fundamental factors.
Could Bitcoin follow the trend of precious metals? Discover why gold and silver extend their rise.