

Bitcoin is experiencing a pullback, with traders closely watching the $90,000 level as a critical point that could determine whether the current downtrend stabilizes or intensifies. This sentiment is influenced by broader risk-off market conditions, fading momentum, and bearish technical signals.
Current Market Scenario
Bitcoin (BTC) has fallen below $92,000 and is now trading under $91,000. This level is being closely monitored by traders, as its ability to hold could stabilize the price, while a break below it might lead to further declines.

The current pullback is occurring amidst a general risk-off sentiment in the market, influenced by concerns such as President Trump’s tariffs and broader market weakness. The inability of Bitcoin to hold short-term support levels suggests a weakening of bullish control.
On-chain data further indicates a cooling of momentum, with profit-taking activities slowing down, contributing to a cautious market mood.
Peter Brandt's Bearish Perspective
Renowned trader Peter Brandt, with a significant following on X, has shared a bearish outlook on Bitcoin. He has suggested that the price could potentially decline to the range of $58,000 to $62,000.
58k to $62k is where I think it is going $BTC
— Peter Brandt (@PeterLBrandt) January 19, 2026
If it does not go there I will NOT be ashamed, so I do not need to see you trolls screen shot this in the future
I am wrong 50% of the time. It does not bother me to be wrong pic.twitter.com/NDOuSrqLwa
Brandt's analysis points to a rising wedge pattern that has been forming over several months, which is typically considered a bearish signal indicating a potential loss of bullish momentum.
Bitcoin has now become a diagonal pattern. I do NOT trade diagonal patterns. I leave these for the Elliott Wave guys who without fail after the next big move will tell us how they had it all figured out $BTCpic.twitter.com/hj04jJHdod
— Peter Brandt (@PeterLBrandt) January 20, 2026
Brandt himself acknowledged that his predictions are not always accurate, stating that he is "wrong about 50% of the time." Nevertheless, his cautionary remarks have heightened the alertness among traders, particularly those operating on shorter timeframes.
The ongoing inability of Bitcoin to reclaim key resistance levels maintains a cautious outlook for its price forecast.
On-Chain Data Signals Cooling Momentum
Analysis of on-chain data suggests a potential cooling of Bitcoin's upward momentum. The Net Realized Profit and Loss (NRPL) metric from CoinGlass, which tracks realized profits by traders, has shown a slight dip into negative territory after an extended period of positive readings.
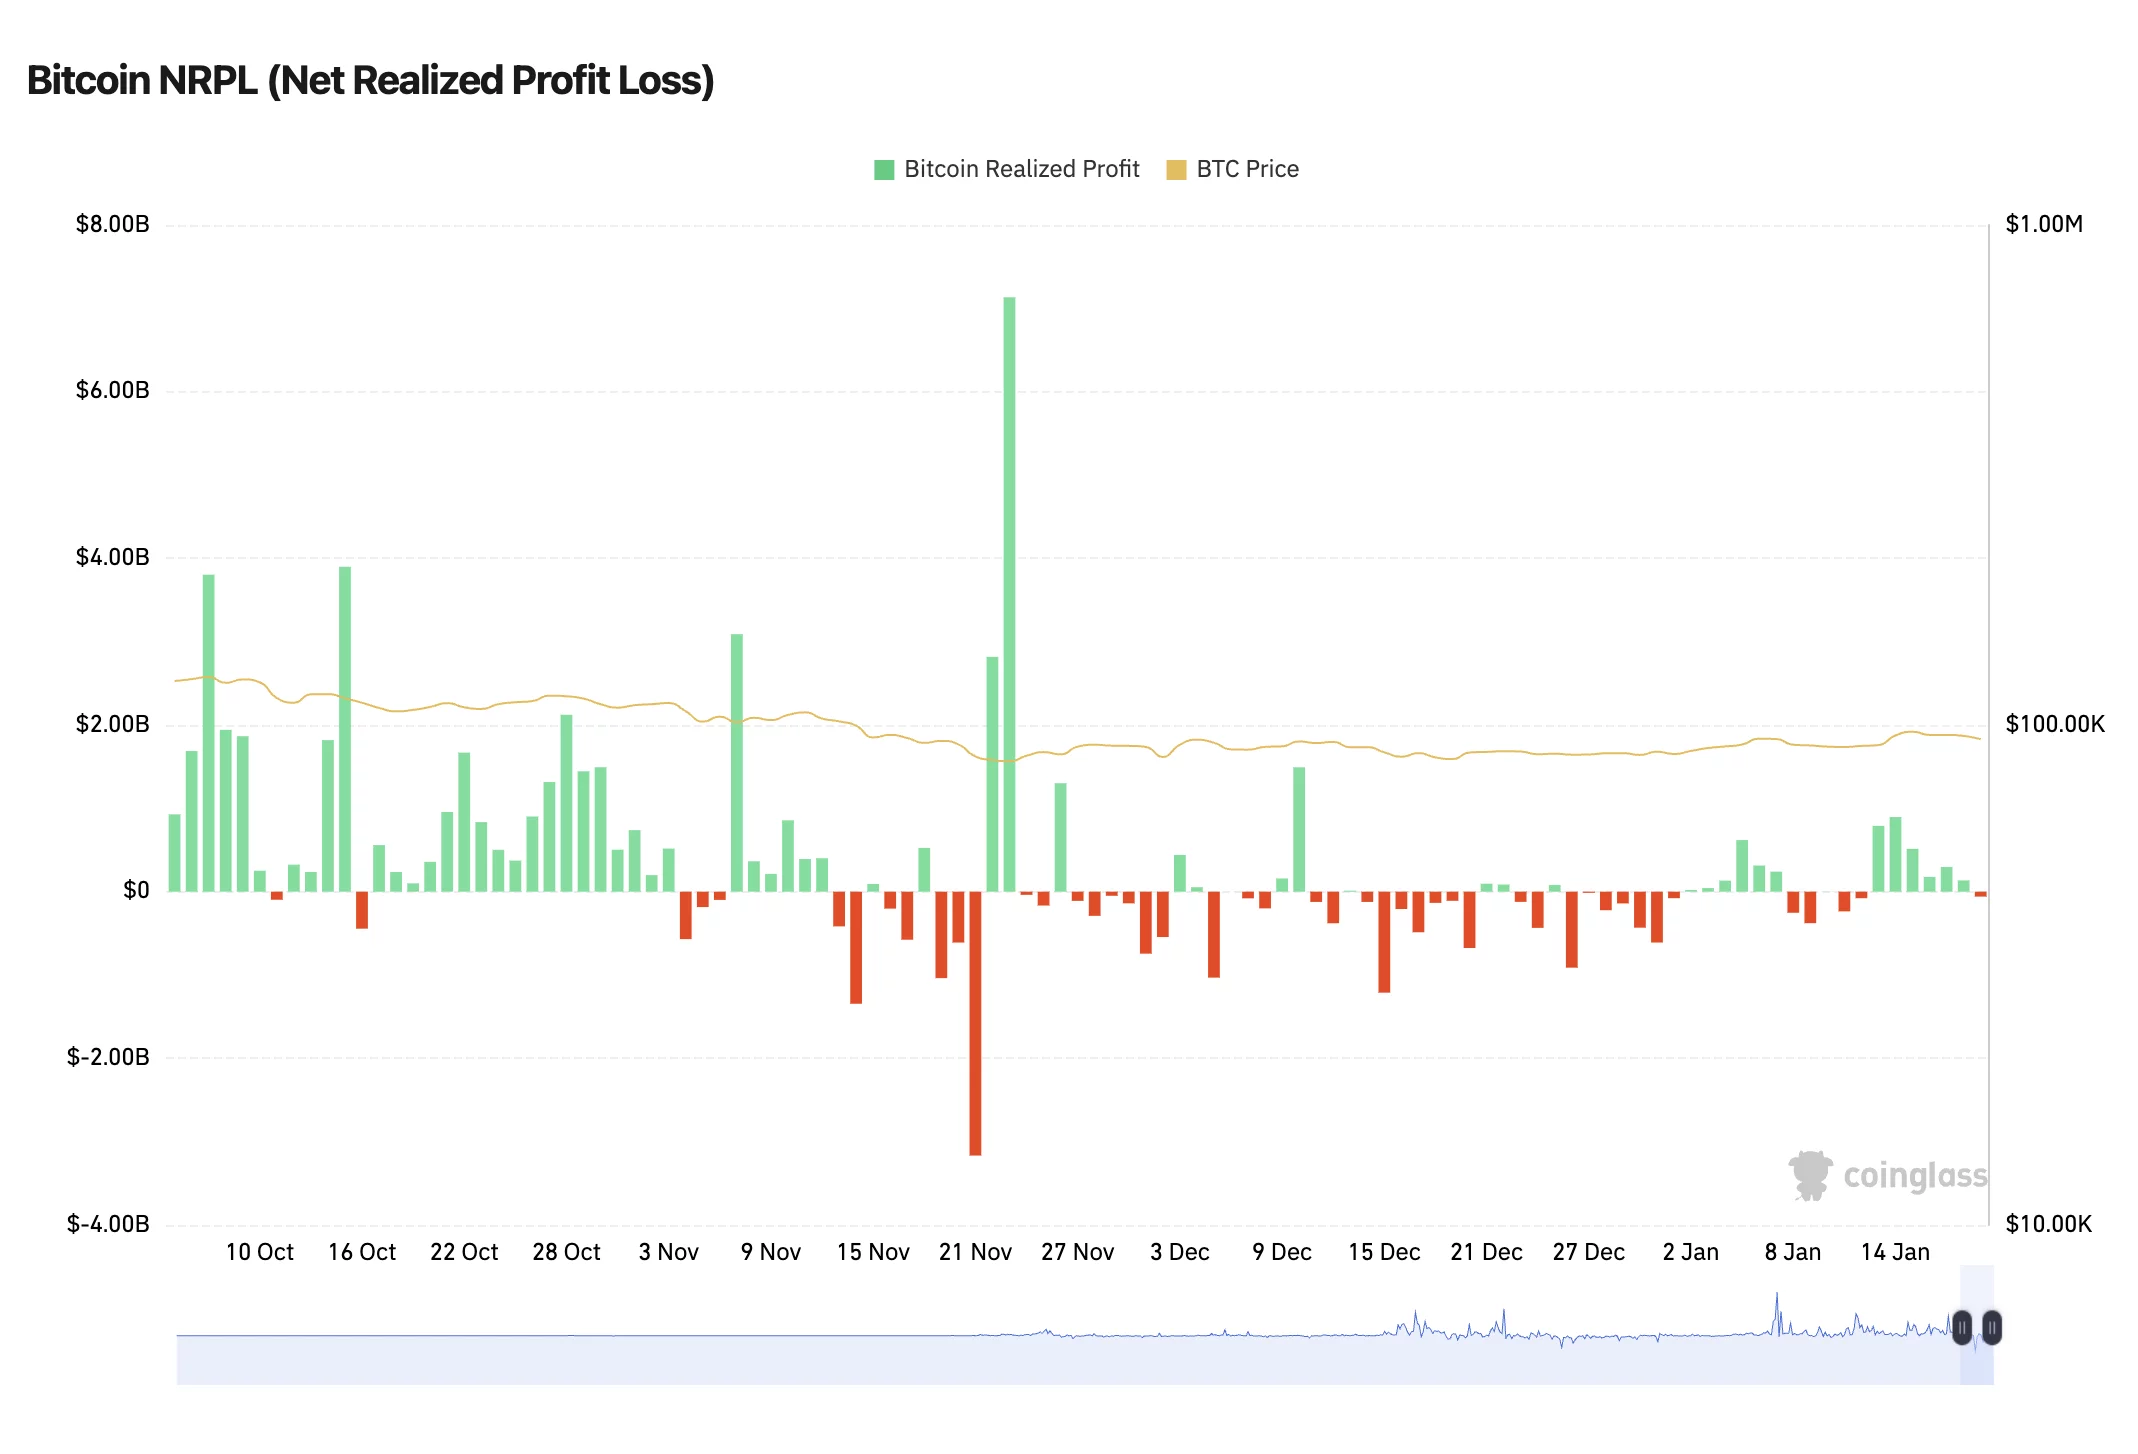
This pattern often occurs when buying interest wanes and the market begins to absorb selling pressure. While this does not necessarily signal an imminent sharp downturn, it could indicate increased fragility for Bitcoin if new buyers do not emerge to support the price.
Bitcoin Price Prediction: Key Levels to Watch
A sustained move above the $97,000–$98,000 resistance zone would indicate a resurgence of bullish control and could potentially break the current bearish trend, providing a significant boost to Bitcoin's price.
Conversely, a break below the channel support at $90,000–$91,000 would increase the probability of a more substantial pullback. Such a scenario could potentially lead Bitcoin towards the $62,000 mark, although this outcome is not guaranteed.
The current Bitcoin price prediction remains uncertain. While bearish chart patterns and a slowdown in on-chain activity present warning signs, Bitcoin has demonstrated its capacity to surprise traders in the past. The upcoming price movements will be crucial in shaping the short- to medium-term outlook for BTC.