

The Bitcoin price experienced a significant downturn in October, falling by 4% and breaking its consistent seven-year streak of positive performance during the month, often referred to as 'Uptober'. This decline was attributed to a combination of factors including outflows from Bitcoin Exchange-Traded Funds (ETFs), profit-taking by investors, and broader macroeconomic uncertainties that weighed on the market.
An analysis by Fortune highlighted that this was Bitcoin's fourth-worst October performance since 2013 and the worst recorded in the past seven years. In comparison, the S&P 500 stock index saw a gain of 2.3% during the same period.
The sell-off intensified as major Bitcoin and Ethereum ETFs experienced outflows exceeding $550 million in the latter part of the month. Analysts suggested that profit-taking strategies also contributed to the downward pressure, with prominent Bitcoin treasury firms, including Michael Saylor's MicroStrategy, reportedly slowing their accumulation of BTC.
We just experienced the first red October in 7 years!
We also had an historic liquidation in October!
UPTOBER was a fraud, but MOONVEMBER??
imho;
if you can, DCA more!
if you can’t, DO NOT panic sell your bags for cheap!
If you are out of $$ and you are sure of your port,… pic.twitter.com/LH7aYTwQeY
— Blockchain Bob (@blockchainbob) October 31, 2025
Even a temporary trade truce announced between U.S. President Donald Trump and China's Xi Jinping during the week was insufficient to lift Bitcoin back into positive territory for the month.
Earlier in October, President Trump's announcement on the 10th of the month regarding an additional 100% tariff on China's exports had triggered over $19 billion in liquidations within a 24-hour period, marking the largest single-day liquidation event in the history of the cryptocurrency market.
Following the announcement of the U.S.-China trade truce, sentiment remained subdued, partly due to comments from Federal Reserve Chair Jerome Powell indicating that another interest rate cut in December was far from certain.
$BTC Stillness Is the Signal
Price moves less, conviction moves more.
Exchange supply hits cycle lows while long-term holders tighten grip liquidity’s thinning quietly.
ETFs keep absorbing without headlines, mining difficulty climbs, and volatility compresses.
This isn’t… pic.twitter.com/7ylx3uoCW7
— Senior 🛡️🦇🔊 (@SeniorDeFi) October 31, 2025
Bitcoin On-Chain Signals Show Resilience
Despite the recent dip in its price, on-chain data for Bitcoin continues to indicate underlying strength within the network. Bitcoin reserves held on exchanges reached all-time lows in October, with a reduction of over 200,000 BTC within a single month. This decrease signifies that a smaller quantity of coins is currently available on exchanges for immediate sale, suggesting that investors are opting to move their holdings to private wallets, potentially with the intention of holding them for the long term.
This trend of investors transferring coins to their own wallets is a strong indicator that they may be planning to hold their Bitcoin for an extended period, reflecting a belief in its long-term value proposition.
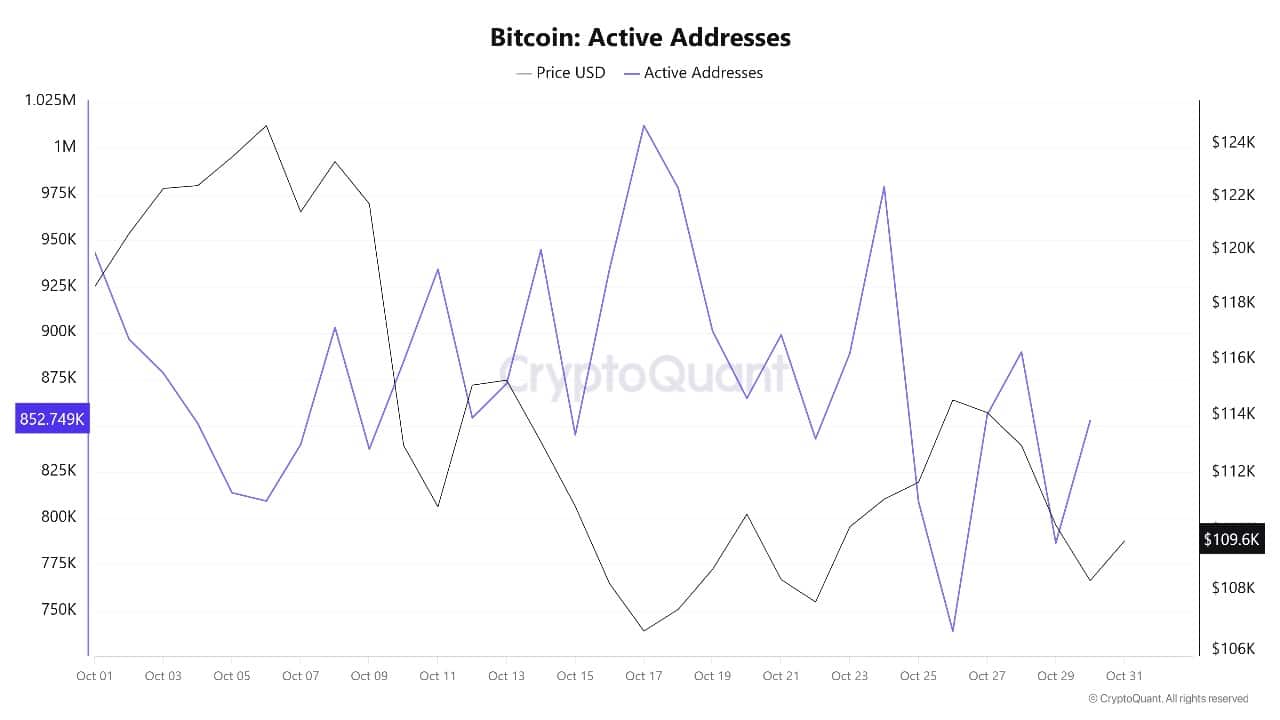
The shrinking supply of Bitcoin available on trading platforms contributes to increased scarcity, which could potentially lay the groundwork for a future price rally. This pattern of coin withdrawal is reminiscent of the conditions observed prior to Bitcoin's significant upward price movement in 2020 and underscores a strong conviction in Bitcoin's enduring value.
Even with the recent ETF outflows, institutional accumulation appears to be continuing, as evidenced by large players transferring coins into private custody. Furthermore, Bitcoin's network activity, including the number of active addresses and transaction counts, has remained robust. This indicates that despite the monthly price decline, users are actively engaging with and utilizing the Bitcoin network.
Bitcoin Price Prediction
Analyzing the weekly price chart, Bitcoin is currently trading at approximately $109,496.77. While the price has pulled back from its October high, it remains comfortably above critical support levels. The current price is situated above the 50-week simple moving average (SMA), which stands at $102,843.54. The longer-term 200-week SMA is significantly lower, at $54,756.36.
These moving average levels are considered strong support for the Bitcoin price and are instrumental in limiting further potential losses.
The price chart illustrates that Bitcoin is currently moving within an upward-trending channel. Resistance is identified near the $125,761 mark, with support found around $102,843. The overall uptrend is expected to remain intact as long as the price sustains its position above the lower support line of the channel and the key moving averages.
Technical indicators suggest a temporary pause in the bullish momentum. The Relative Strength Index (RSI) is currently at 50.32, positioned precisely at the midpoint. This reading indicates a balance between buying and selling pressure, suggesting that the market is in a phase of consolidation rather than clear directional control.
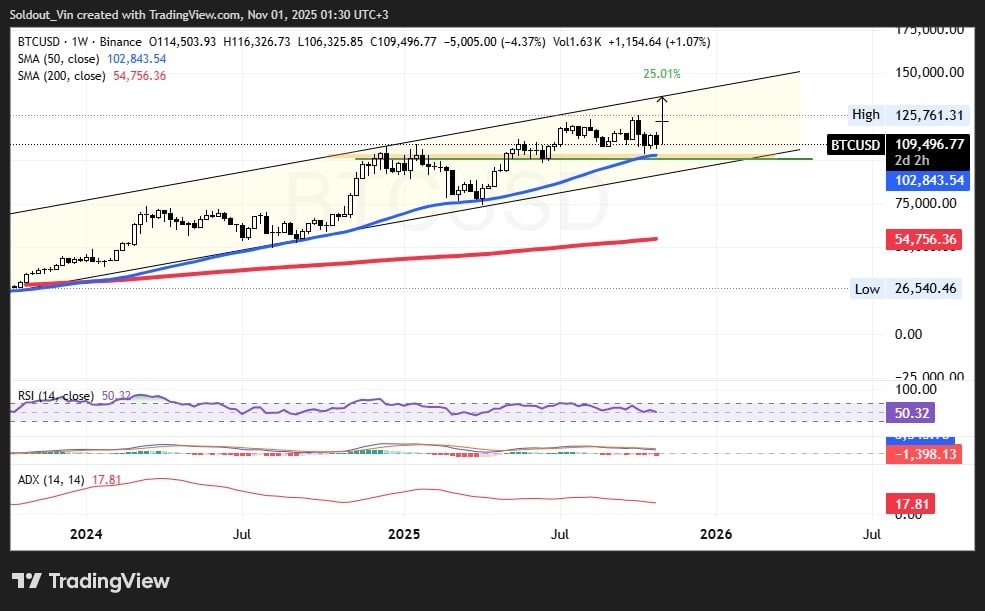
The Average Directional Index (ADX) is reading 17.81, which signifies a weak current trend. This suggests that new momentum will be required to initiate another upward price movement. If buyers re-enter the market and successfully push the price beyond the resistance level of $125,761, Bitcoin could potentially attempt to reclaim its previous highs. Conversely, if the price falls below the 50-week SMA at $102,843, further selling pressure might emerge, driving the price towards the next significant support level at $54,756.
The MACD (Moving Average Convergence Divergence) indicator remains in neutral territory, implying that sideways price action is likely in the near term. Low trading volume and a lack of strong directional momentum suggest that Bitcoin may trade within a narrow range in the coming weeks.
Should the price find support and bounce from the $102,843 level, a renewed attempt to reach the $125,761 resistance could attract more buyers. However, a decisive break below this support level could lead to Bitcoin testing deeper price levels before bullish sentiment re-emerges.
The price action in November will likely be heavily influenced by global financial trends and the potential return of institutional investment into the market. If macroeconomic risks subside and ETF flows turn positive again, the Bitcoin price could resume its upward trajectory, potentially setting the stage for another rally.
Alternatively, the price might continue to consolidate, with traders and investors awaiting a significant catalyst for the next major market move. Traders are advised to closely monitor the support level at $102,843 and the resistance level at $125,761, as decisive breaks beyond these points could provide a clearer indication of Bitcoin's future price direction.