

Bitcoin is still navigating a corrective phase, but the underlying structure suggests controlled movement rather than an impulsive bearish trend. The price is reacting predictably to higher-timeframe levels, and volatility has compressed, a common precursor to significant price expansion.
The crucial point is that the current market behavior is indicative of digestion, not distribution. Bitcoin's performance around the current resistance zone will be a key determinant in whether this move represents another lower high or the beginning of a broader continuation.
Bitcoin Price Analysis: The Daily Chart
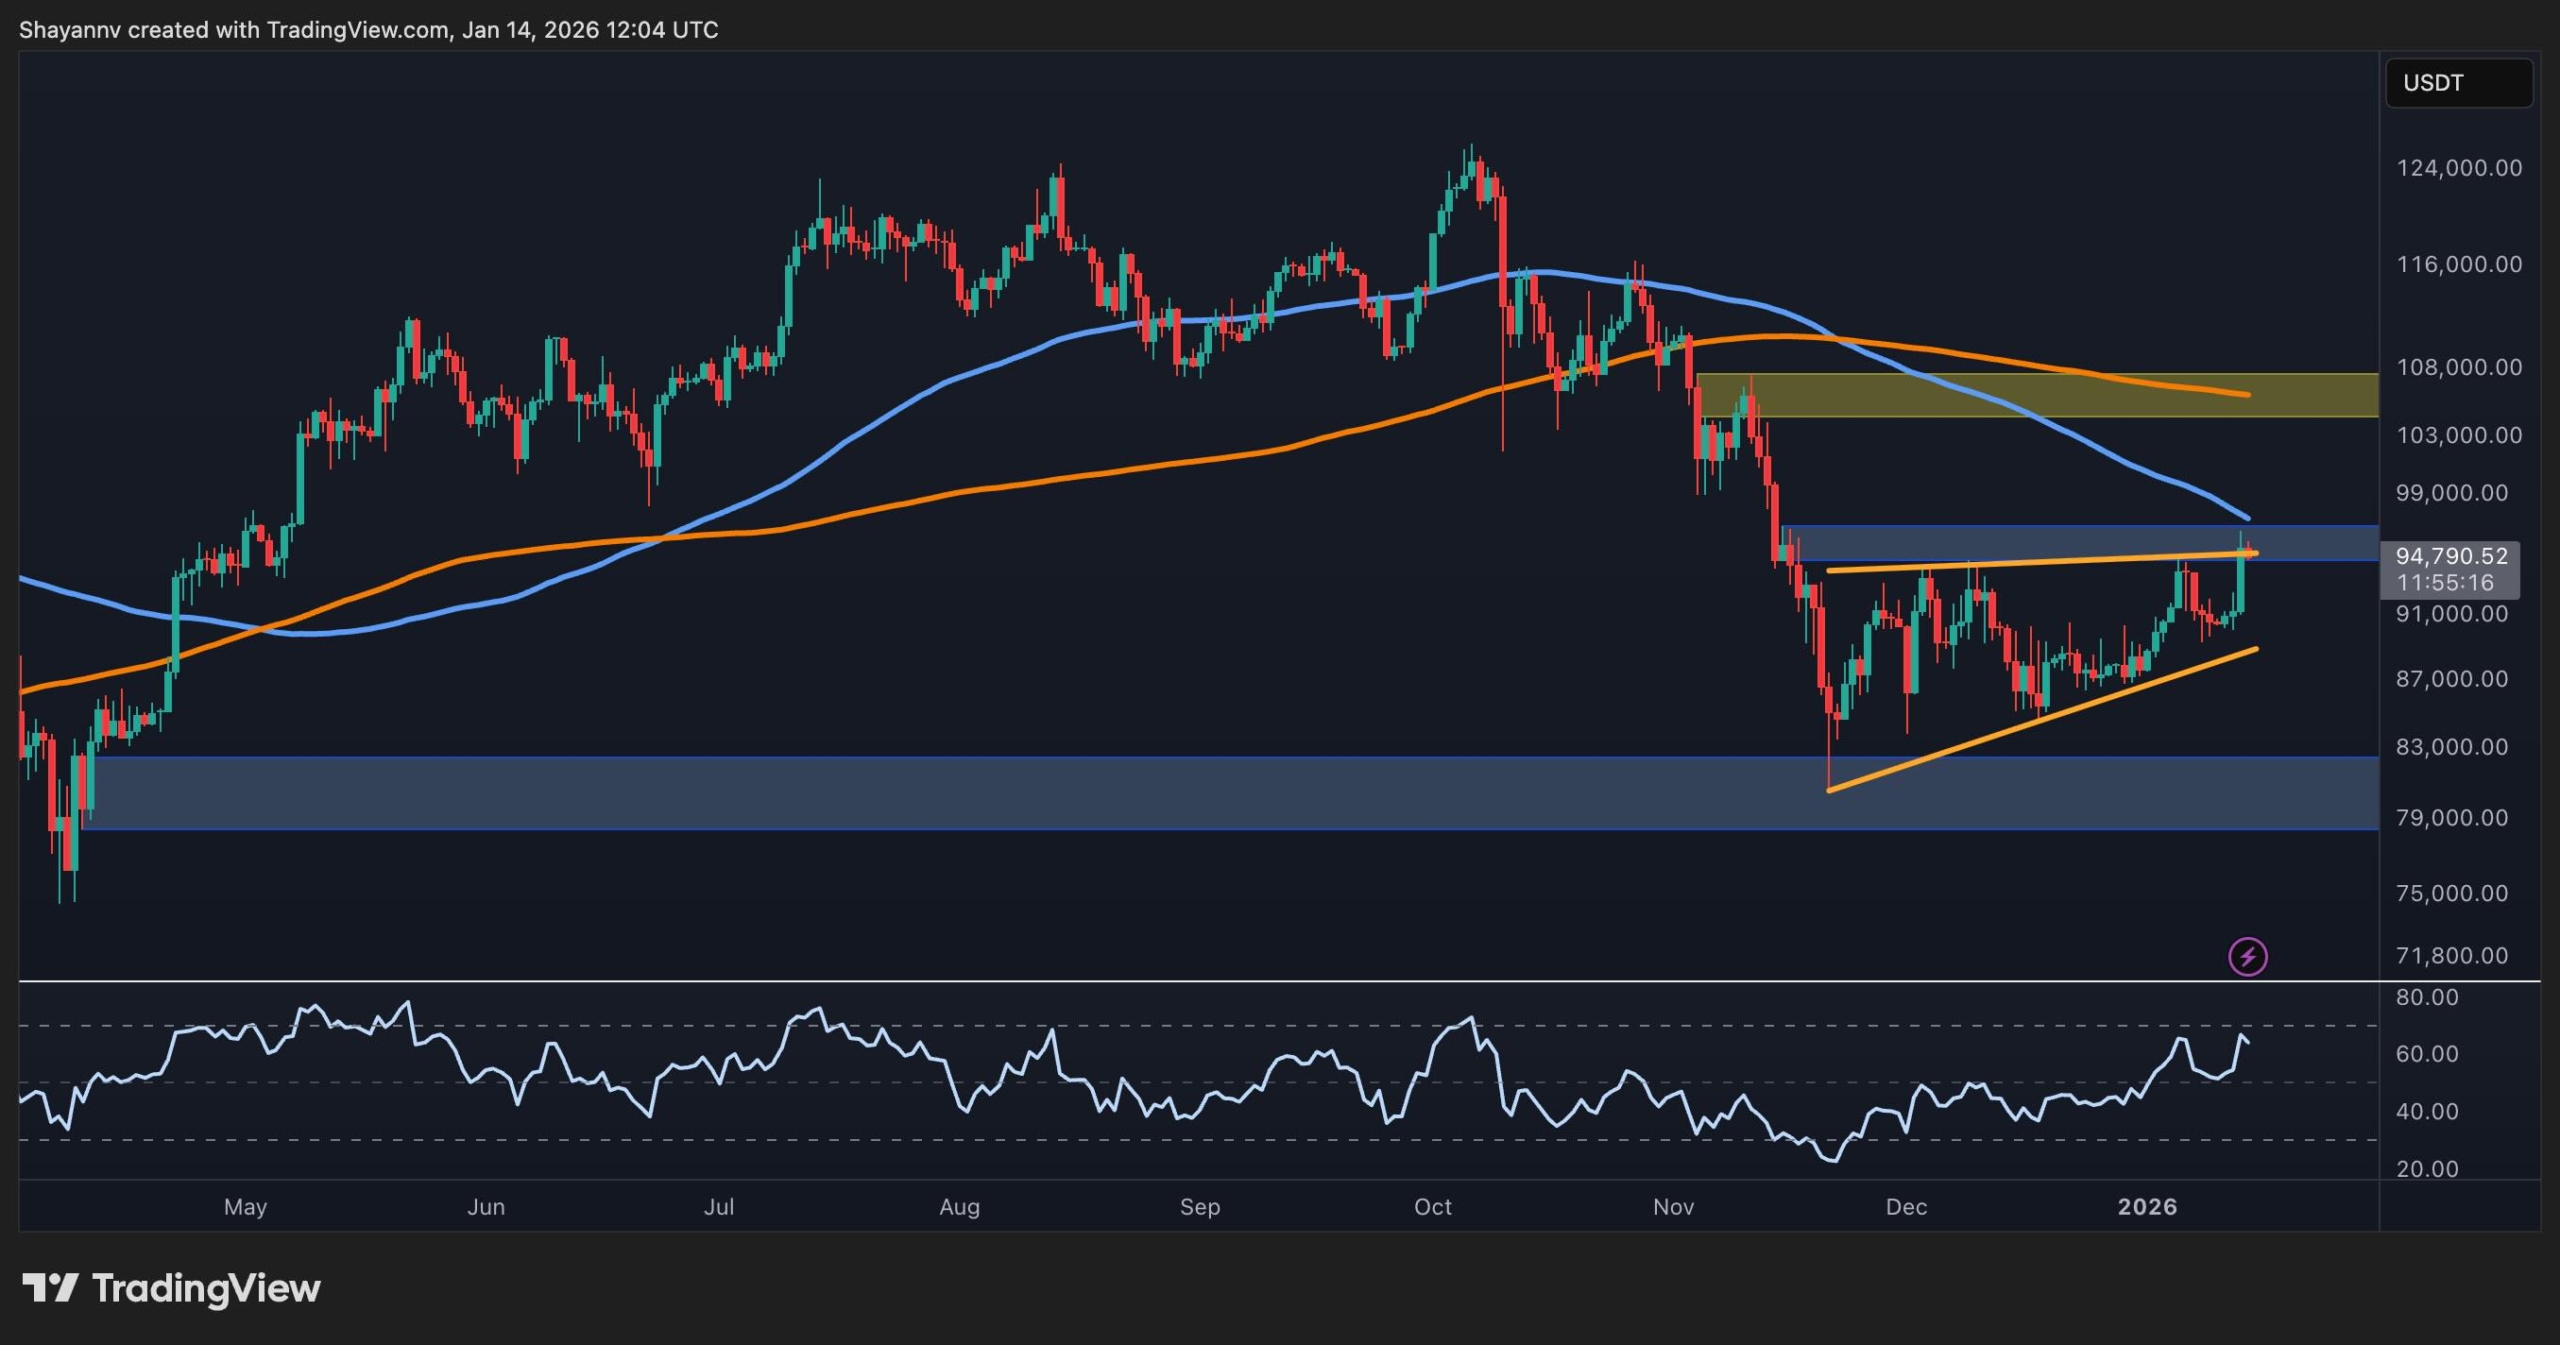
On the daily timeframe, Bitcoin is trading below both the 100-day and 200-day moving averages. These averages are situated within a well-defined resistance zone, an area that has previously acted as a supply flip multiple times, making rejection at this point technically valid.
Despite this, the daily chart structure continues to exhibit higher lows since the November bottom, indicating that sellers have not yet regained complete control. As long as the price maintains its position above the higher-low base and avoids losing the demand zone below, the current market action can be characterized as a corrective range rather than a trend reversal.
BTC/USDT 4-Hour Chart
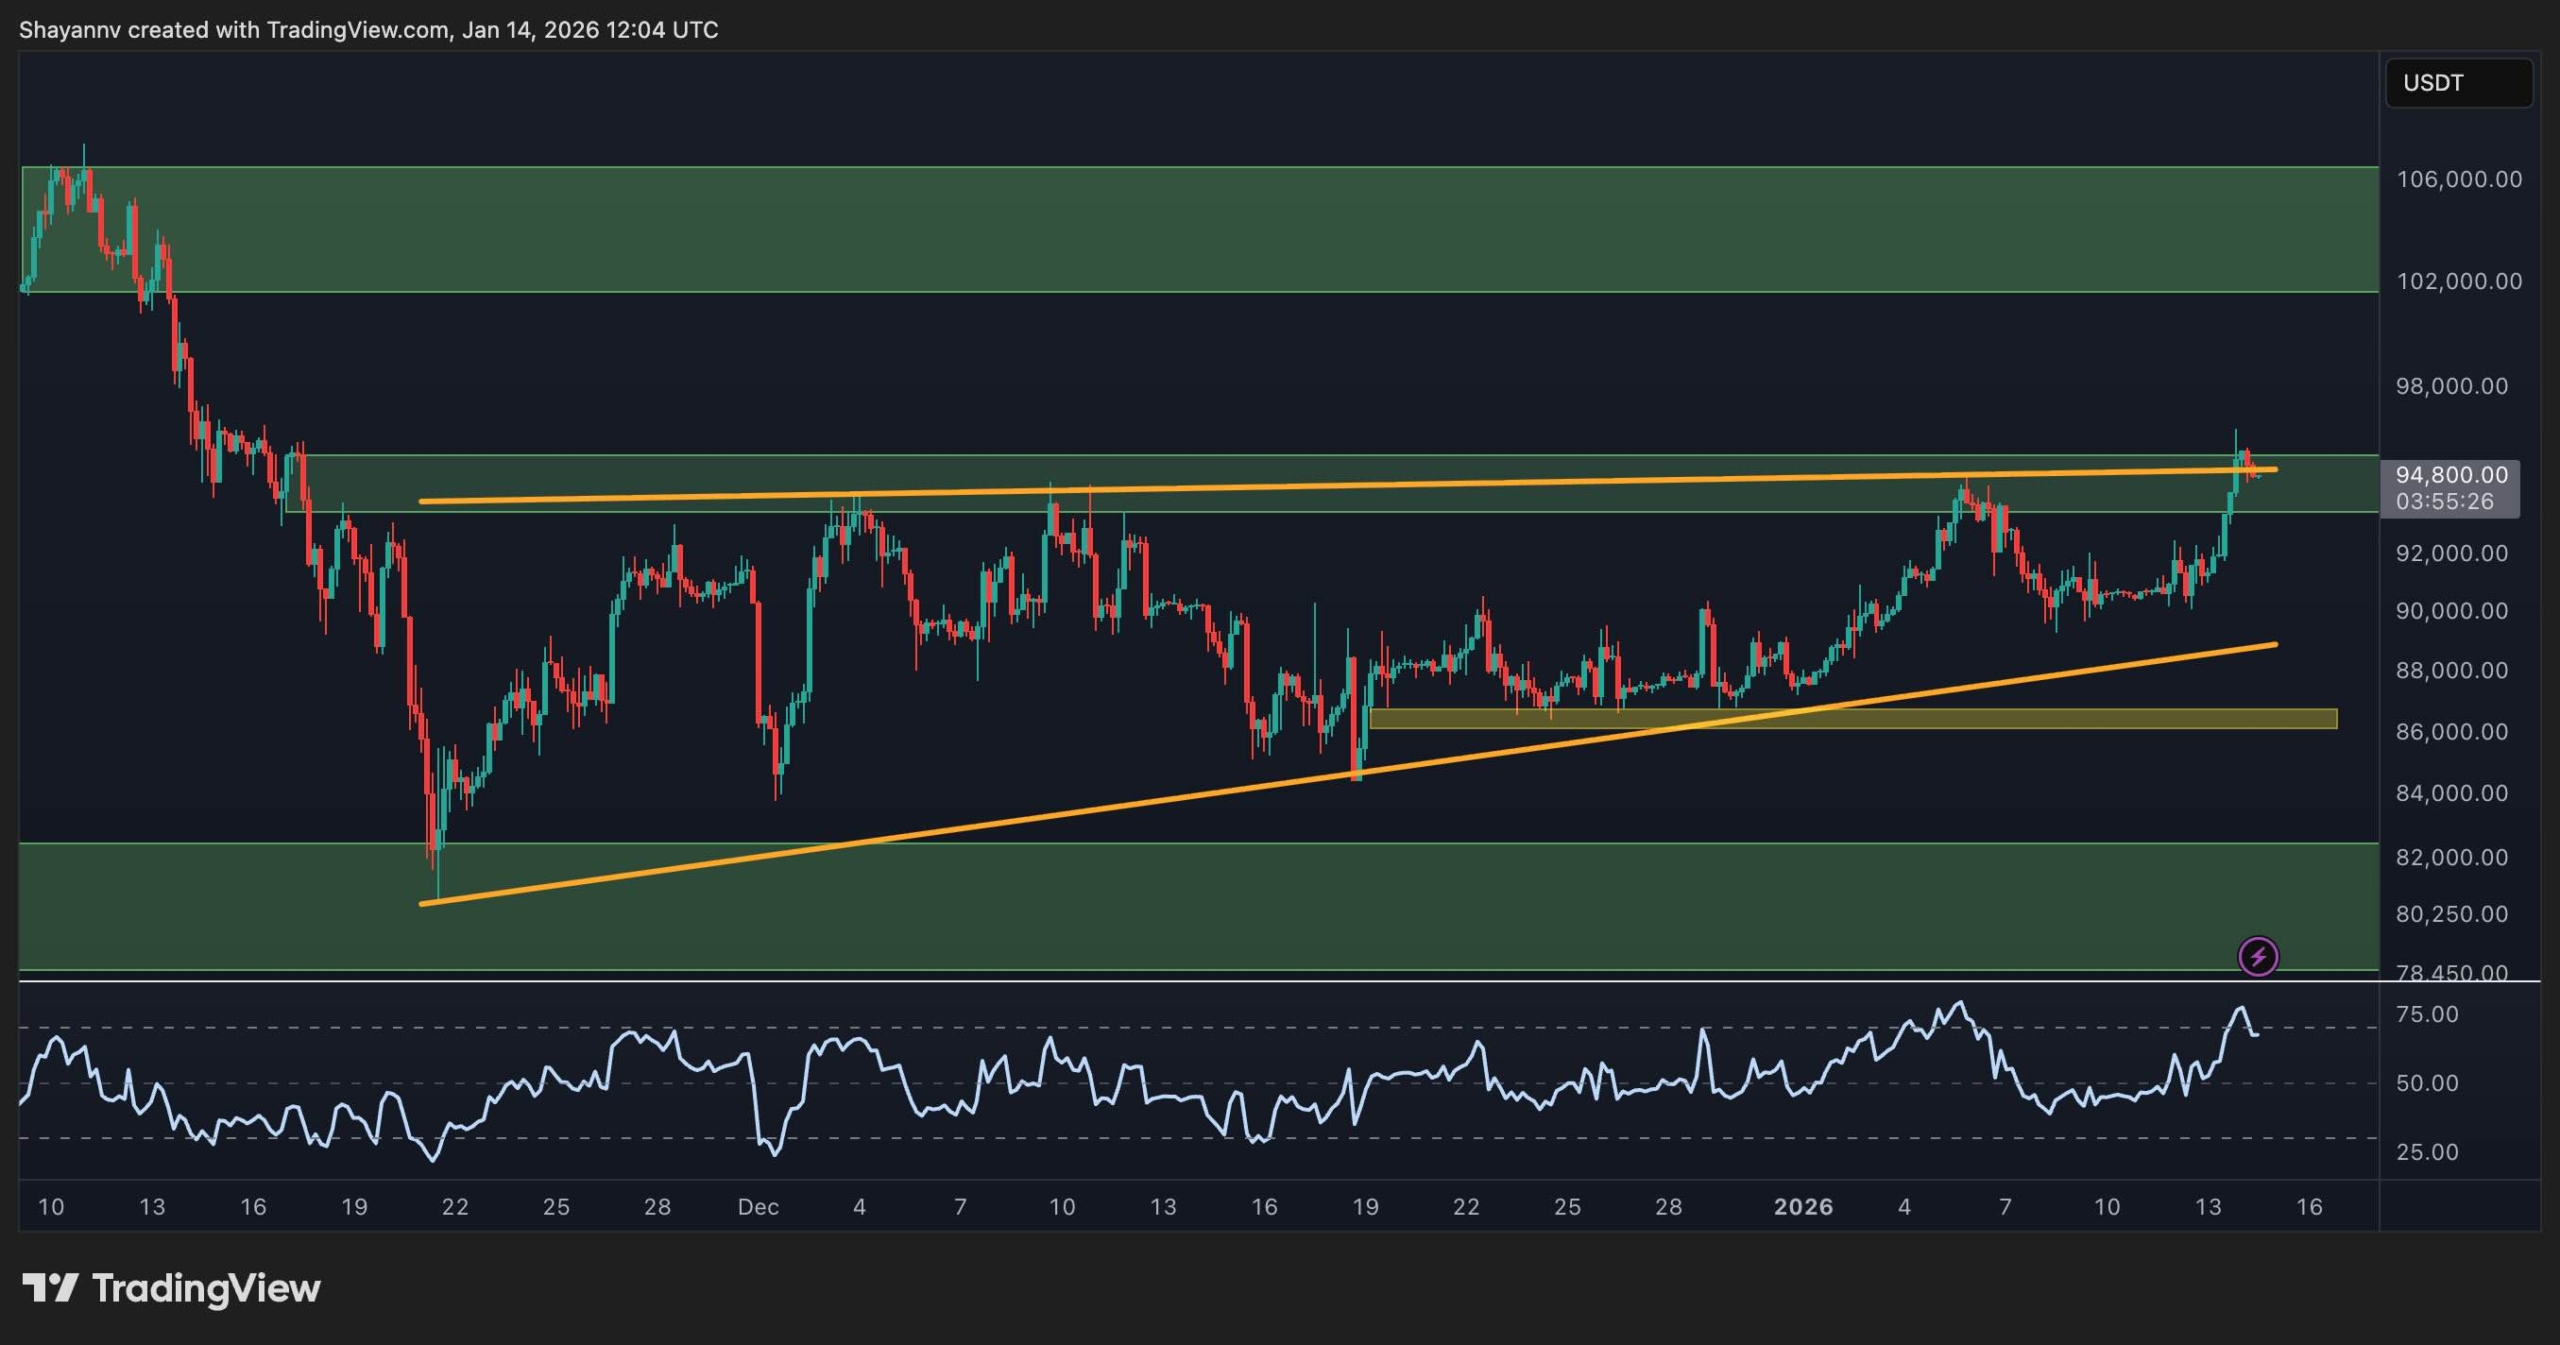
Examining the 4-hour chart reveals a rising wedge or ascending corrective structure that is currently pushing into resistance. The price has recently tested the local supply level and has stalled, while the Relative Strength Index (RSI) has entered overbought territory and is now pulling back.
The market is currently in a balanced state. A strong breakout above the horizontal resistance level at $95,000, coupled with a breach of the higher boundary of the wedge pattern, would create an opening for the price to advance towards the next daily supply zone located just above $100,000. Conversely, a rejection at the current level would likely cause the price to rotate back within the pattern and potentially test the lower range support. Consequently, Bitcoin's mid-term price action is heavily contingent on its reaction to the present resistance level.
Sentiment Analysis
Futures data indicates that the average order size is predominantly attributed to retail traders when compared to the previous year, suggesting that larger institutional players are largely inactive. Retail participation has notably increased near the resistance levels, which elevates the risk of short-term fakeouts. This combination of factors typically results in choppy price action rather than immediate continuation.
The overall market sentiment is cautiously bullish, though it appears crowded and retail-driven at these higher price points. This suggests that Bitcoin may require either a clear breakout supported by significant volume from major players or a downward reset to shake out weaker hands before the next directional move can materialize.
