

Key Market Indicators
The MVRV ratio, a key metric for assessing Bitcoin's market value relative to its realized value, has recently fallen below its 365-day moving average. This development, highlighted by CryptoQuant analyst ShayanMarkets, signals a potential market bottom and an opportune moment for investors to consider accumulation. Historical patterns suggest that such dips often precede significant price recoveries and long-term upward trends for Bitcoin.
MVRV Ratio Analysis
Bitcoin's MVRV ratio has dipped below its 365-day Simple Moving Average (SMA), a trend that CryptoQuant reported on October 22. This indicator has historically marked local bottoms in the Bitcoin market, suggesting that the cryptocurrency may be undervalued. Such periods are often followed by substantial price increases. ShayanMarkets, a CryptoQuant analyst, noted that this metric historically indicates potential market bottoms, advising investors to be cautiously optimistic about Bitcoin's current valuation. Discussions across various crypto forums reflect this cautious optimism, with market analysts also emphasizing the influence of external economic factors on Bitcoin's future trajectory.
Historical Precedents and Current Data
The significance of this metric is underscored by past performance. For instance, in June 2022, a similar dip in Bitcoin's MVRV ratio below its 365-day average was followed by a notable 100% price increase. This historical correlation highlights the MVRV ratio's predictive power in identifying market trends.
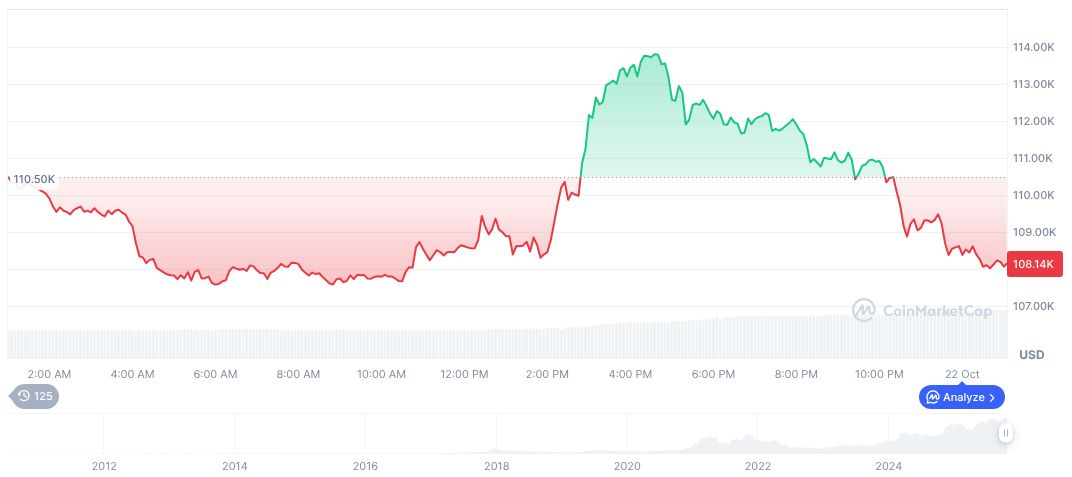
As of the latest data, Bitcoin (BTC) is trading at $107,698.81, with a market capitalization of $2.15 trillion. Despite a minor 0.80% decline in the past 24 hours, Bitcoin maintains a dominant market share of 59.09%. The substantial 24-hour trading volume indicates continued investor interest.
Research from Coincu suggests that favorable external regulatory changes could further support potential bullish trends for Bitcoin. Historical data, often corroborated by analytics from sources like Glassnode, consistently shows a correlation between MVRV trends and subsequent price surges, making the current period particularly interesting for market observers.