

Bitcoin is once again testing a crucial macro resistance zone. According to market analyst Rekt Capital, the current structure is showing striking similarities to previous cycle tops. His latest monthly chart highlights a repeating pattern of rallies, rejections, and weakening support, warning that the next move could determine whether BTC holds its long-term trajectory or enters a deeper corrective phase.
Historical Rallies Show a Consistent Pattern
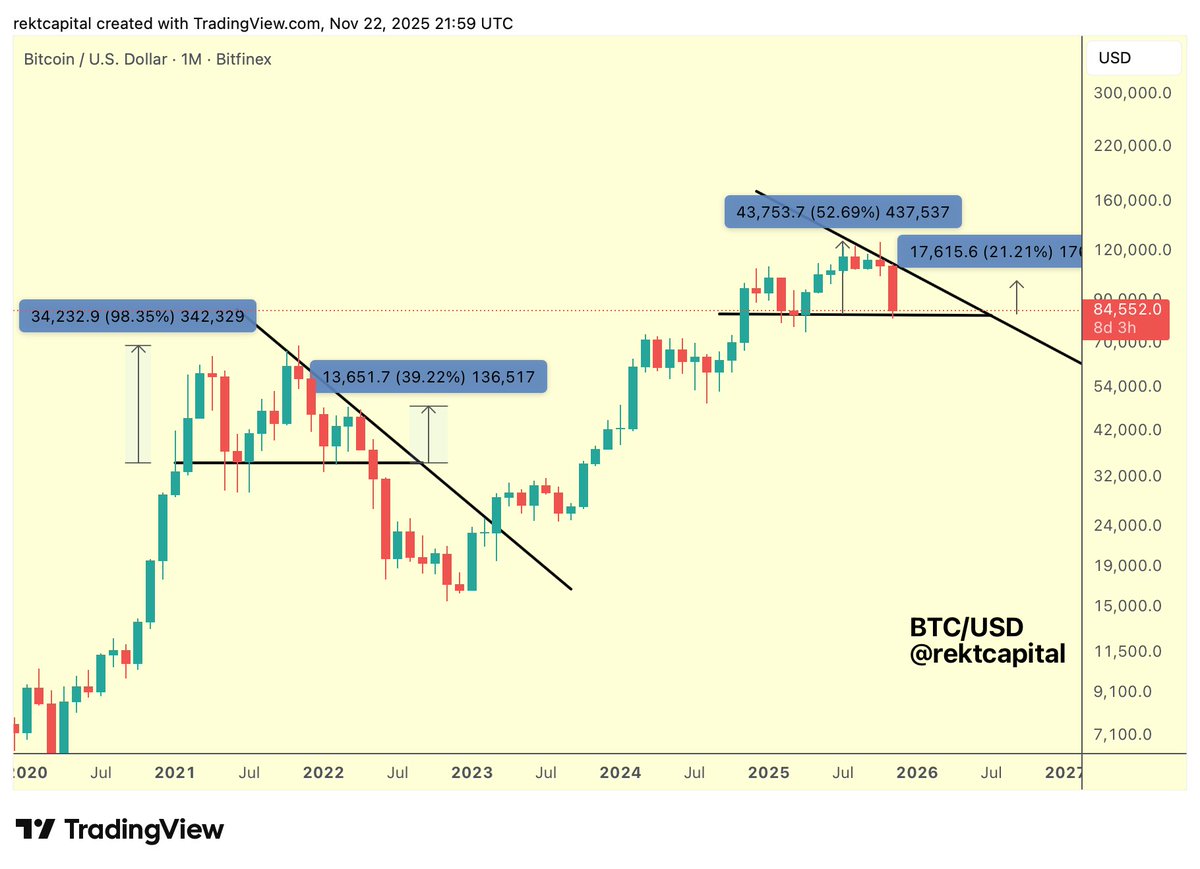
In past macro cycles, Bitcoin has often produced a strong rally immediately after breaking above the Macro Descending Triangle base.
- •In 2021, this breakout produced an almost +100% overextension before the trend failed.
- •Even the smallest rebound before the breakdown reached approximately 39%, reflecting fading support before the complete collapse.
Rekt Capital notes that these “smallest rallies” tend to precede major breakdowns, acting as the market’s final relief bounce before supply overwhelms demand.
This Cycle’s Structure Mirrors Earlier Peaks
In the current cycle, Bitcoin’s strongest rally beyond the same macro base has been +52%, which is much smaller than the previous cycle’s +100% but aligned with the pattern of diminishing returns.
Based on this structure, if history rhymes, a new relief rebound from current prices would likely represent the smallest rally of the cycle, roughly half of the largest move, which Rekt Capital estimates around 20%.
A +20% move from recent lows places Bitcoin directly beneath the Macro Downtrend line (black trendline), the same level that previously triggered major rejections in earlier cycles.
Why the Macro Downtrend Matters Now
The chart shows Bitcoin pulling back sharply from its recent peak near $120,000 and approaching a long-term horizontal support zone. If BTC attempts a relief rally from these levels, the Macro Downtrend overhead remains the key barrier.
A rejection at this downtrend would echo the 2021 breakdown structure and could signal a broader trend reversal.
Conversely, a clean breakout above the Macro Downtrend would invalidate the bearish fractal and open the door for a retest of six-figure prices.
What Traders Should Watch
Rekt Capital’s chart highlights three essential levels:
- Macro Downtrend Resistance – The cycle-defining rejection point.
- Horizontal Support Zone – The line Bitcoin has held multiple times before major expansions.
- Projected Relief Rally Target (~20%) – The area where the next rejection historically occurs.
Bitcoin’s reaction at these levels will determine whether this is a temporary correction within a bull market, or the start of a larger macro reversal.