

The world’s largest cryptocurrency has declined by more than 2 percent over the past 24 hours, contributing to a decrease in the broader crypto market capitalization to approximately $1.786 trillion. Trading volumes have shown signs of exhaustion, indicating that market participants are awaiting clearer signals from institutional flows and macroeconomic conditions.
Key Market Insights
- •Bitcoin has fallen below $90,000 as large holders, often referred to as whales, have exited their long positions and increased their short exposure, while retail investors continue to buy during price dips.
- •Spot ETF flows on December 10 totaled $223.5 million, with significant inflows concentrated in BlackRock's IBIT, while Grayscale's GBTC and other ETFs experienced continued outflows.
- •Technical indicators suggest ongoing weakness, with bearish patterns forming and no clear reversal signals currently present.
This downturn occurs at a time when several underlying indicators suggest growing caution among Bitcoin's largest market participants. Although price volatility has been compressed in recent weeks, on-chain behavior indicates a shift in sentiment beneath the surface. The imbalance appears most pronounced among whales, who are reversing previous bullish positions just as retail traders are leaning into the dip.
Whale Behavior Shifts to Shorting While Retail Accumulates
Data highlighted by analyst Joao Wedson indicates that whales have begun closing their long positions and reopening shorts after months of heavily favoring upward momentum. In contrast, retail traders are adopting the opposite strategy, treating every pullback as a buying opportunity. This divergence between these two investor cohorts bears resemblance to the market structure observed between February and April 2025, a period characterized by a tightening trading range and extended periods with minimal price advancement.
Whales have closed their longs after heavily positioning to the long side, and today they’re starting to take some short positions again — while retail is doing the opposite.
The pattern of this metric versus price looks somewhat similar to what we saw between February and April… https://t.co/DmEoQshULo https://t.co/W6ghuoi5cr
— Joao Wedson (@joao_wedson) December 10, 2025
Visual comparisons of whale-versus-retail delta show a noticeable shift: green retail accumulation spikes are appearing precisely as whale-driven flows retreat to neutral or negative territory. Historically, when this pattern has emerged in previous cycles, Bitcoin has often moved sideways for longer than anticipated, leading to frustration for both bullish and bearish investors.
Liquidation data reinforces this cautionary tone. Approximately $171 million in Bitcoin positions were liquidated over the last 24 hours, with longs accounting for the majority of the losses. This imbalance underscores how traders betting on a quick rebound were caught off guard as Bitcoin slipped below the $90,000 threshold.
ETF Activity Presents Mixed Signals Amidst Concentrated Inflows
Spot Bitcoin ETFs continue to influence market sentiment, but the latest data from December 10 reveals a complex picture. Total flows reached $223.5 million, with nearly all of this inflow originating from a single product: BlackRock’s IBIT, which absorbed $192.9 million. Several other issuers struggled to attract demand, and some experienced continued asset outflows. Grayscale’s GBTC, which was once the dominant provider of institutional Bitcoin exposure, recorded another $33.8 million in outflows, extending its multi-week losing streak.
This concentration of inflows suggests that institutions may be reallocating assets rather than exiting the market entirely. However, the uneven distribution limits the positive impact on Bitcoin’s price. Historically, broad inflows across multiple ETF products have coincided with stronger upside momentum, while fragmented flows have often preceded periods of market stagnation.
Market analysts observe that ETF data remains one of the clearest indicators of institutional appetite, and the current trend indicates that demand is present but inconsistent. Until inflows broaden beyond IBIT and stabilize across the sector, many anticipate that Bitcoin’s recovery attempts will remain volatile.
Technical Indicators Signal Persistent Weakness
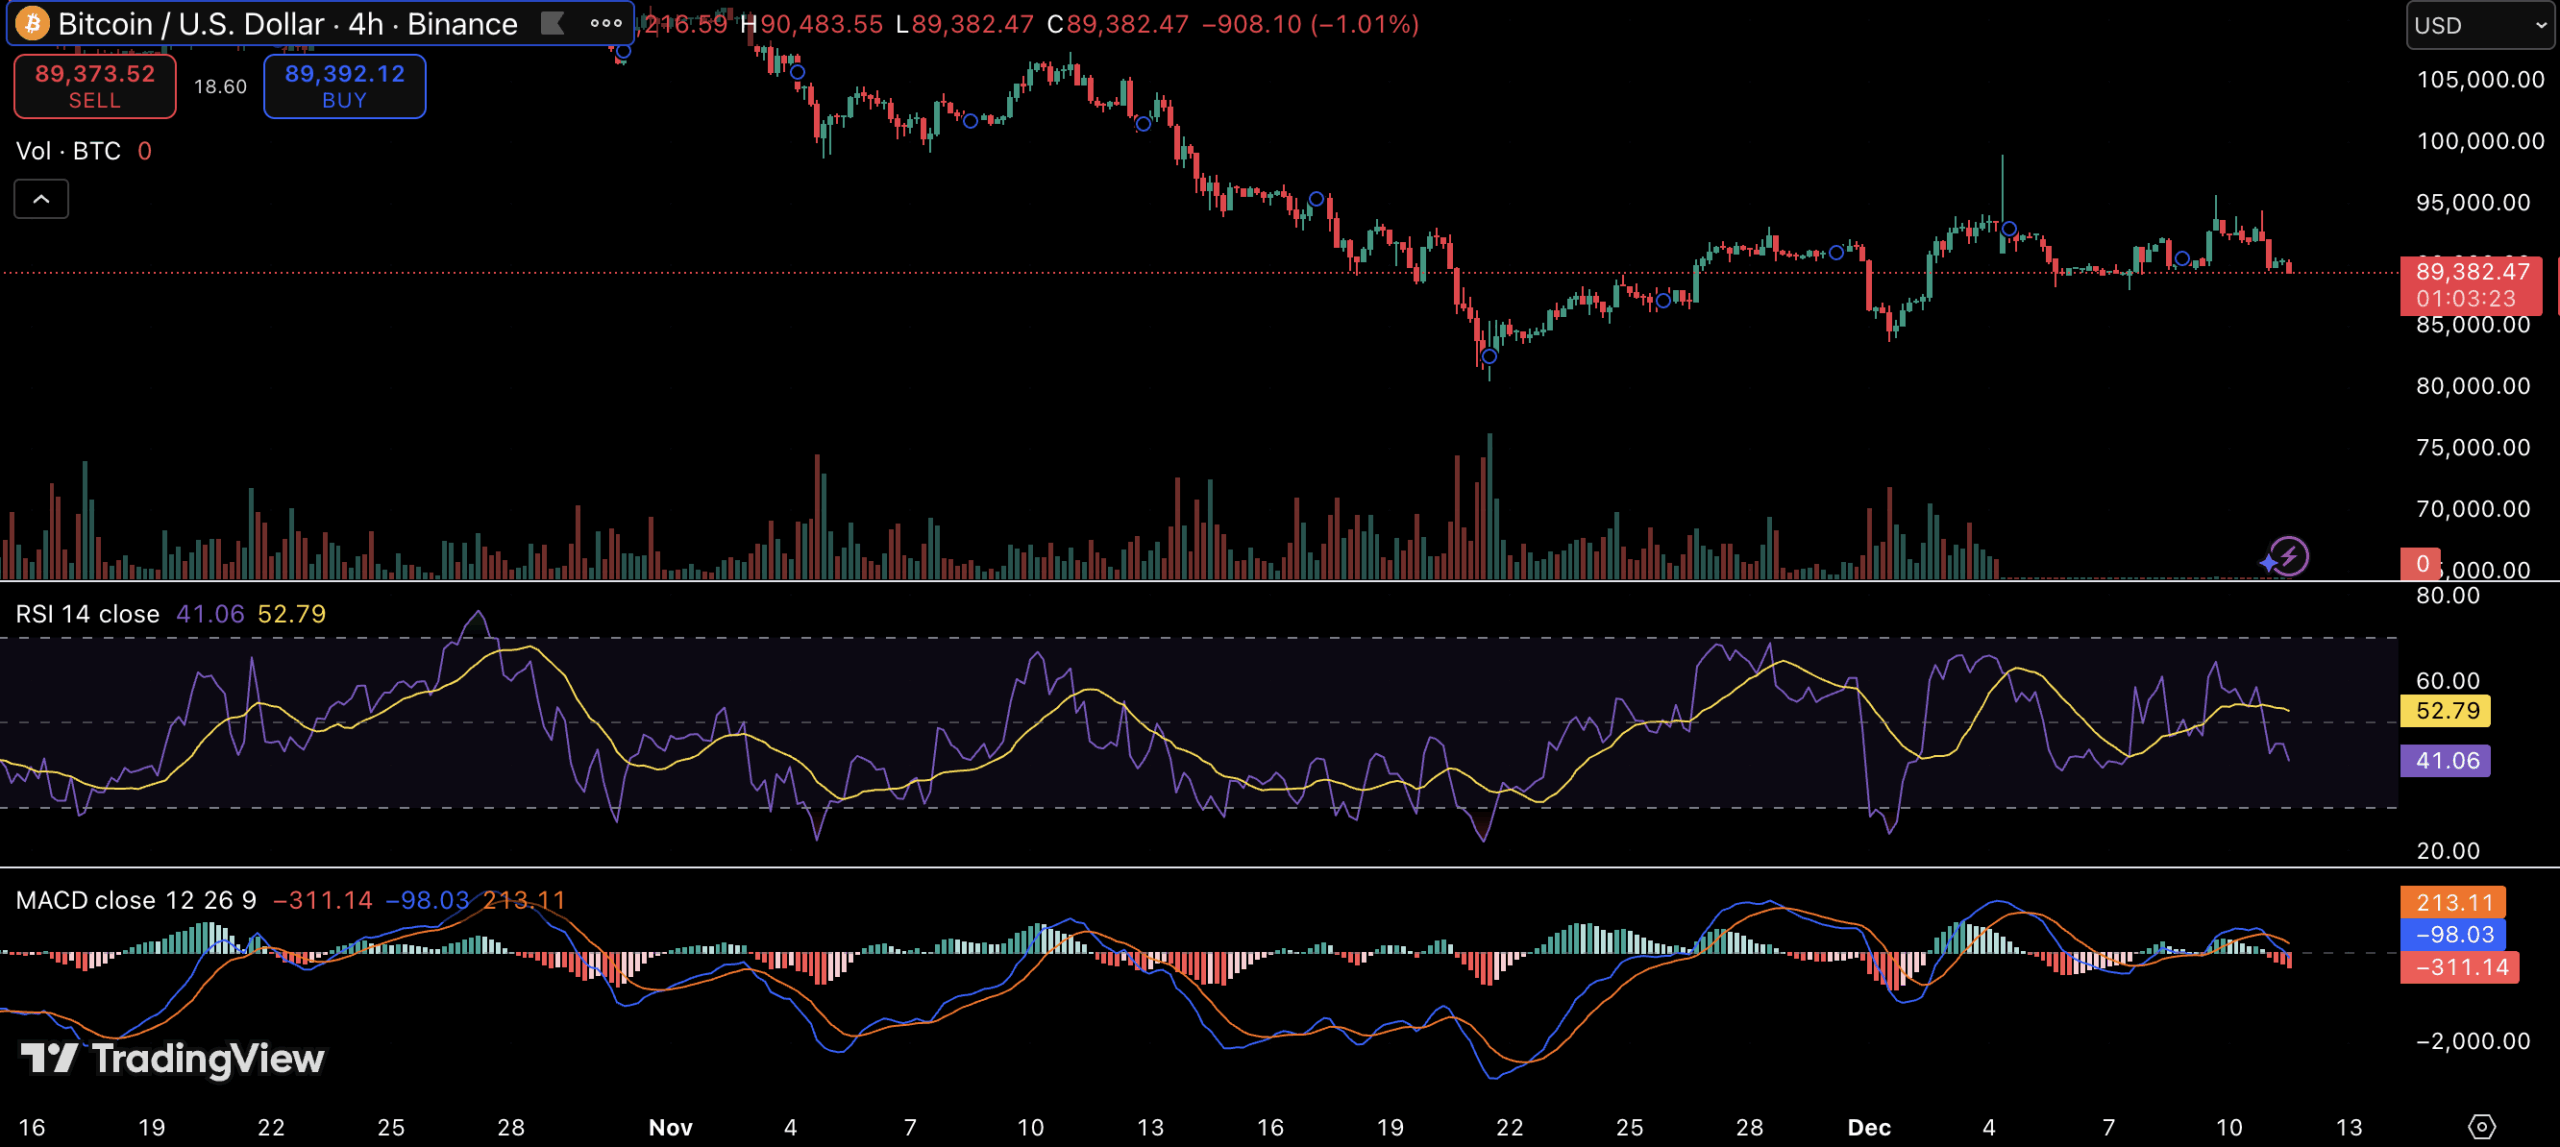
Bitcoin's technical landscape adds another layer of uncertainty. On the 4-hour chart, the Relative Strength Index (RSI) is positioned near 41, suggesting fading momentum but not yet indicating extreme oversold conditions. The Moving Average Convergence Divergence (MACD) also remains in negative alignment, with no bullish crossover developing.
Crypto strategist Ali Martinez has highlighted the formation of a potential bearish flag on Bitcoin’s mid-term charts. If this pattern is confirmed, it could signal a potential pullback toward the $70,000 level. However, such a scenario would require a confirmed breakdown below current support levels.
Bitcoin $BTC: If this is a bearish flag, the target is $70,000. https://t.co/wI72dGQP6P
— Ali (@alicharts) December 9, 2025
For bullish investors, the primary objective is to reclaim the $94,000 area, which has repeatedly acted as a resistance level over the past two weeks. Without a sustained break above this zone, Bitcoin risks trading within a narrowing range that has historically preceded significant price movements.