

The Bitcoin price has seen a 3% drop in the last 24 hours, trading at $95,324. This movement occurs as crypto investment products continue to attract significant investor interest, marked by record inflows.
Last week, cryptocurrency funds experienced inflows totaling $2.17 billion, representing the highest figure of 2026 so far and the largest weekly gain since October, according to European asset manager CoinShares. The majority of this capital entered the market early in the week. However, Friday saw outflows of $378 million, influenced by geopolitical tensions in Greenland and renewed concerns over tariffs.
James Butterfill, CoinShares’ head of research, also indicated that market sentiment was affected by the expectation that Kevin Hassett, a prominent candidate for US Fed Chair, would likely maintain his current position. Bitcoin was the dominant asset in last week’s fund inflows, attracting $1.55 billion, which accounted for over 70% of the total inflows.
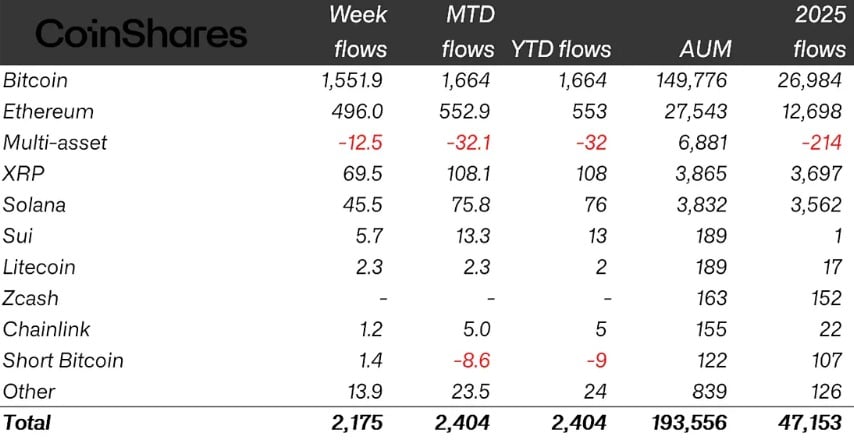
Ether followed with $496 million in inflows, while XRP and Solana attracted $70 million and $46 million, respectively. Smaller altcoins such as Sui and Hedera recorded minor inflows of $5.7 million and $2.6 million. Despite proposals under the US Senate’s CLARITY Act that could potentially limit stablecoin yields, funds for Ether and Solana demonstrated resilience.
Analyzing fund types, multi-asset and short Bitcoin products were the only categories to experience outflows, totaling $32 million and $8.6 million. On the issuer side, BlackRock’s iShares ETFs led the market with $1.3 billion in inflows, followed by Grayscale Investments with $257 million and Fidelity Investments with $229 million.
Geographically, the United States accounted for the largest portion of inflows, contributing $2 billion. Sweden and Brazil, conversely, saw small outflows of $4.3 million and $1 million, respectively. With these gains, total assets under management in crypto funds have now surpassed $193 billion, reaching a level not seen since early November, indicating a resurgence in investor confidence.
Bitcoin Price Analysis: Bullish Breakout Following Rounded Bottom Pattern
The 4-hour chart for Bitcoin indicates a series of bullish developments, although recent price action suggests some short-term consolidation. The price recently rebounded from a significant support zone situated between $87,500 and $88,500. This area has previously served as a strong accumulation zone and has successfully absorbed selling pressure on multiple occasions, establishing a solid foundation for potential upward movements.
Following its interaction with this support level, Bitcoin formed a rounded bottom pattern between January 6 and January 12. This pattern is often interpreted as a signal of a shift in market sentiment from bearish to bullish. The gradual nature of the rounded bottom reflects a diminishing selling momentum, allowing buyers to gradually regain control of the market.
A bullish breakout occurred subsequent to the formation of the rounded bottom, propelling the price above previous resistance levels around $91,000. This breakout was characterized by strong upward momentum, with the price briefly testing the $96,000 region. The confirmation of this breakout signifies that buyers were decisively entering the market after a period of consolidation, suggesting a potential continuation of the short-term uptrend.
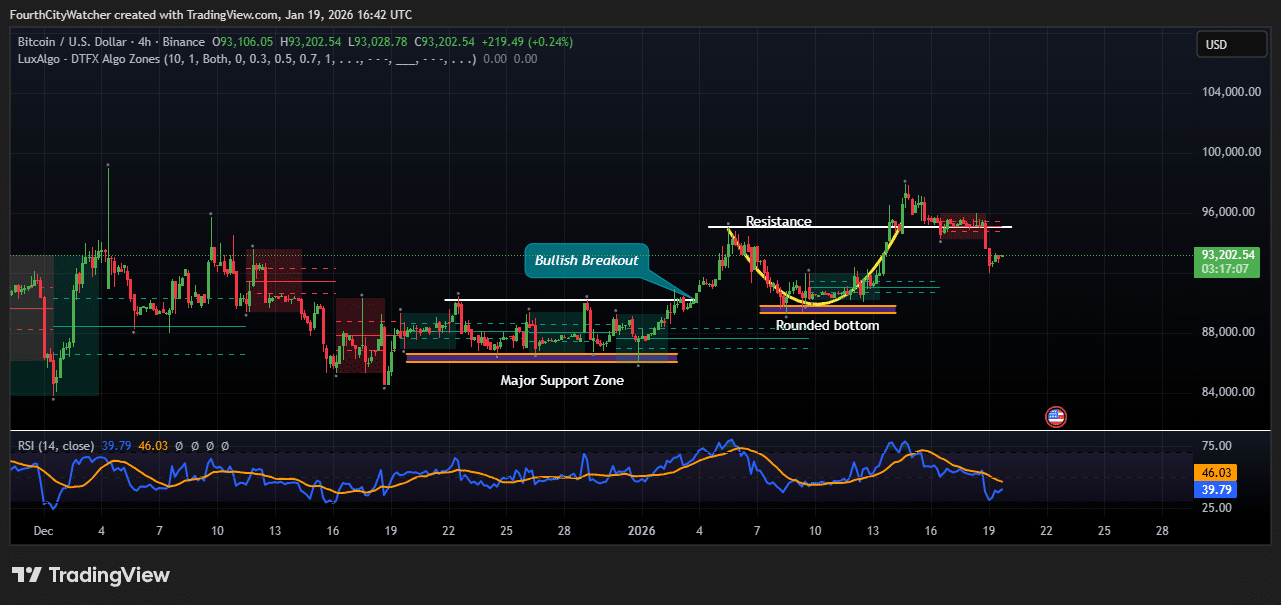
Currently, the price has experienced a minor pullback after reaching the $96,000 resistance area. This retracement appears to be a healthy market correction, allowing buyers to enter at potentially more favorable levels without jeopardizing the overall bullish structure. The Relative Strength Index (RSI), currently hovering around 39.8, indicates that Bitcoin is not yet in oversold territory, suggesting there is room for further upside potential once buying pressure re-establishes. The 46-level on the RSI also highlights previous resistance in momentum, which may now act as a potential pivot point.
The chart clearly delineates support and resistance structures, with price action respecting the $88,000–$91,000 range before attempting to move higher. The observed rounded bottom and subsequent bullish breakout underscore a transition from accumulation phases to renewed upward momentum. Traders are likely to monitor the $91,000–$92,000 range as a key support level for potential retests, while the $96,000 area remains a significant near-term resistance barrier.