
Bitcoin slipped lower as the new month opened, but according to analyst Michaël van de Poppe, the move fits a familiar pattern rather than signaling a structural shift in the broader trend.
His latest market update points to a combination of automated flows, weakened liquidity, and a retest of a key resistance zone as the drivers behind the decline.
Understanding the Monthly Pattern
Van de Poppe notes that Bitcoin often experiences volatility exactly when a new month begins. As algorithmic trading systems reset, short-term selling pressure tends to emerge, reflected in the sharp early-December drop visible on the TradingView chart.
Liquidity conditions also remain thin. The analyst attributes this to a major washout on October 10, when many market makers suffered losses and subsequently reduced activity. With fewer liquidity providers in the market, even moderate sell orders have a stronger downward impact on price.
Typical move on the markets for $BTC.
Just on the clock, a new month starts, algorithms are activated, and the price is lower.
Liquidity is significantly low. Why? Because a ton of market makers got hammered on 10/10.
Nothing changed in the price action of #Bitcoin.
It was… pic.twitter.com/mNCcdZMl4r
— Michaël van de Poppe (@CryptoMichNL) December 1, 2025
Resistance Rejection and Consolidation
Nothing in Bitcoin’s market structure has meaningfully changed, according to van de Poppe. The cryptocurrency was rejected at a crucial resistance zone, reinforcing a consolidation range that has been forming for weeks.
His chart highlights how Bitcoin repeatedly tapped this resistance and failed to break through, creating a ceiling near the $92K–$94K region. The rejection triggered the downside move currently unfolding.
Bitcoin Price Action Analysis
The TradingView chart illustrates a sharp drop from the local high near $92K, followed by a deep liquidity sweep below $86K before a modest recovery. This aligns with the analyst’s comments about algorithms triggering early-month downside and market makers being unable, or unwilling, to stabilize price during low-liquidity hours.
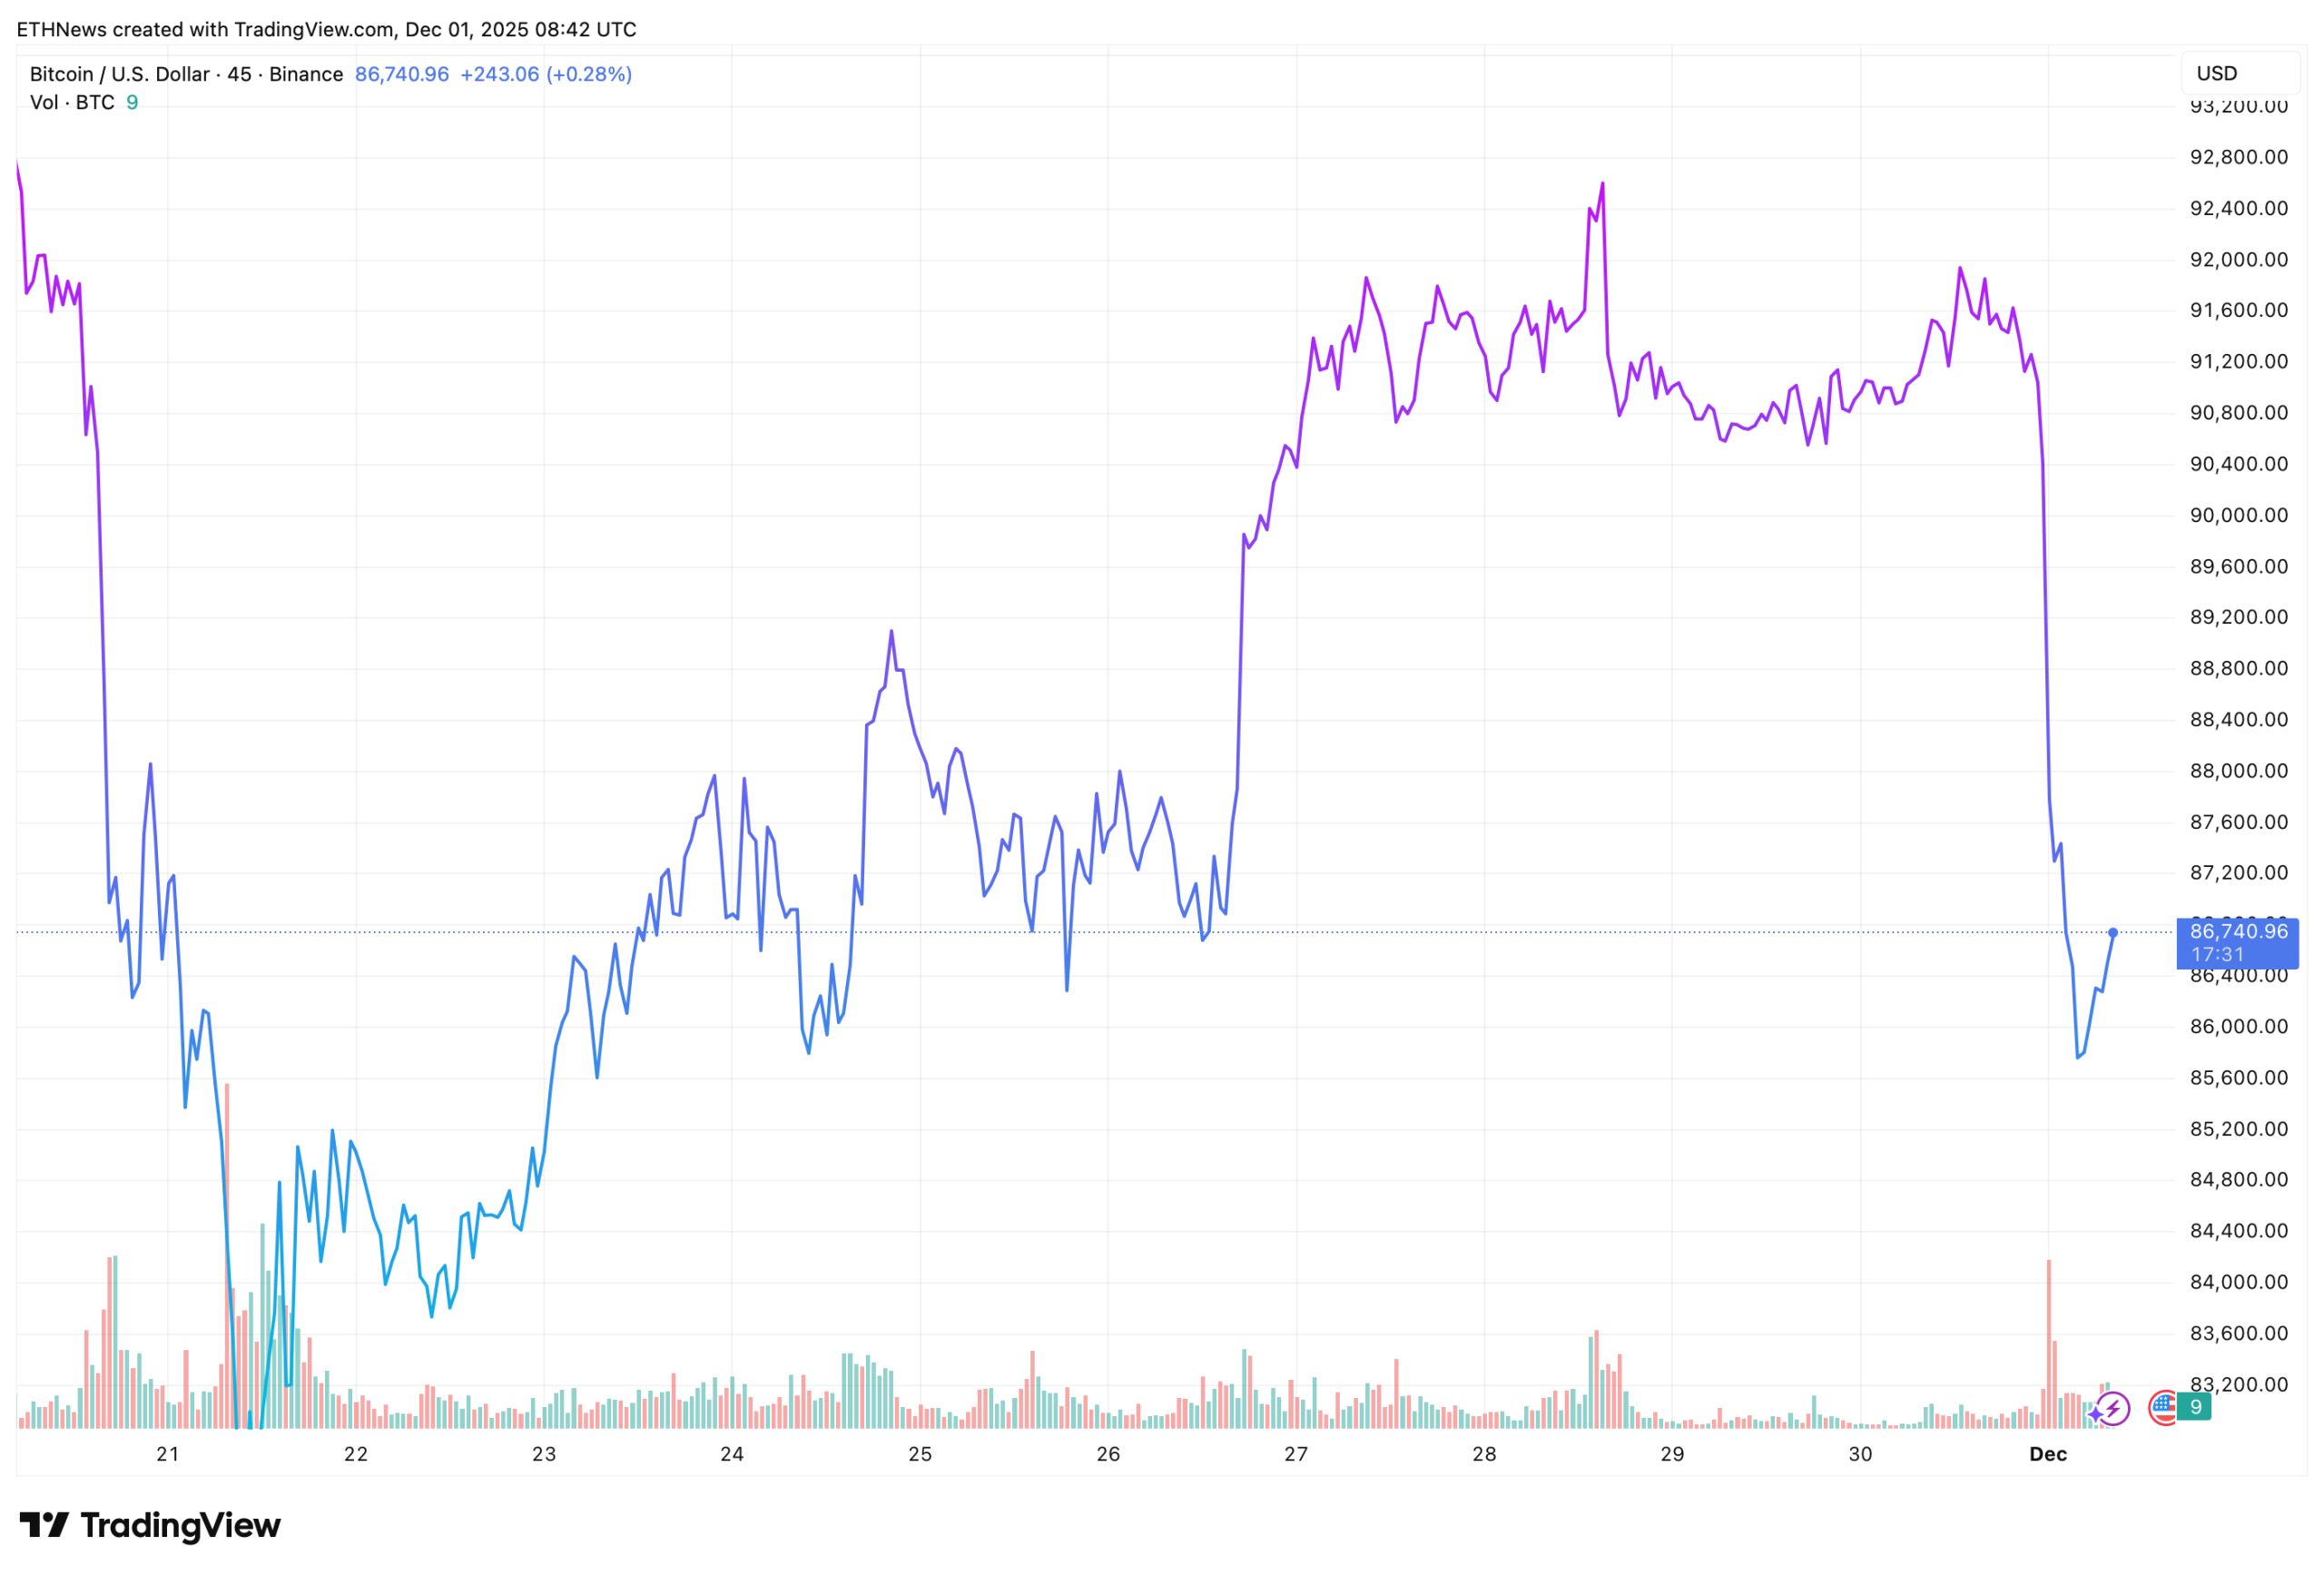
Despite the volatility, the chart also shows buyers stepping back in near the lower range, preventing a further breakdown.
Future Outlook: Retesting Resistance
Van de Poppe remains optimistic despite the pullback. He expects Bitcoin to retest the same resistance level within 1–2 weeks. If the market successfully breaks above that ceiling on the next attempt, he anticipates upside continuation toward $100,000.
For now, Bitcoin continues to consolidate and accumulate strength. According to the analyst, the current dip is less a sign of weakness and more a standard reset in a market still building momentum.