

Historical Parallels: 2021 and 2025 Price Action
When comparing the 2021 and 2025 charts side by side, the similarity is striking.
2021: Double Top, Black Friday Collapse
- •Bitcoin formed a broad double top.
- •A sharp correction around Black Friday marked the start of the major downtrend.
- •What looked like a normal dip eventually turned into a prolonged crash that erased months of gains.
2025: Same Structure, Higher Prices
- •BTC once again formed a weakening ascending structure.
- •The price tapped the upper trendline and failed — very similar to 2021.
- •The selloff that followed is now accelerating.
If this pattern continues to play out, Bitcoin may only be in the early stages of a larger corrective phase.
Bitcoin's Oversold Condition: A Sign of Exhaustion?
The weekly RSI shows a rare signal: Bitcoin is extremely oversold, reaching a zone last seen in 2023.
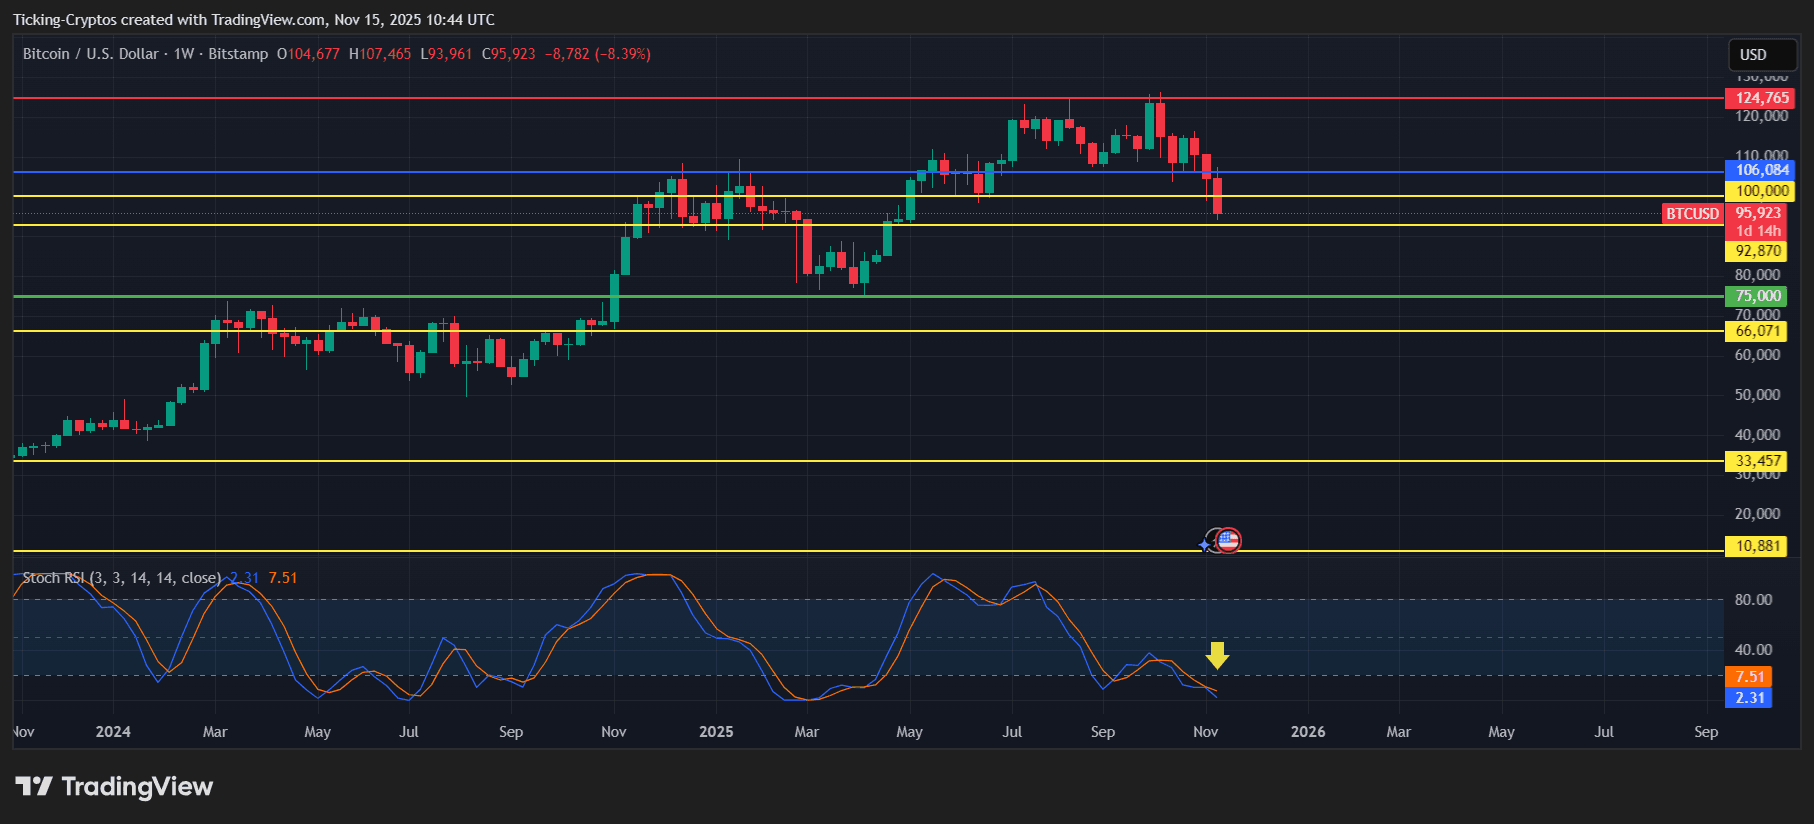
Historically, such readings have triggered strong reversals — but only after the downtrend exhausts itself. During heavy crashes, these oversold periods can extend for weeks or months, as seen in previous instances:
- •2018 breakdown from 6K
- •2020 COVID crash
- •2022 post-FTX collapse
This suggests that while Bitcoin is currently oversold, it may still experience further downside before establishing a definitive bottom.
Bitcoin Price Chart Analysis: Current Market Dynamics
Based on the 4-hour chart:
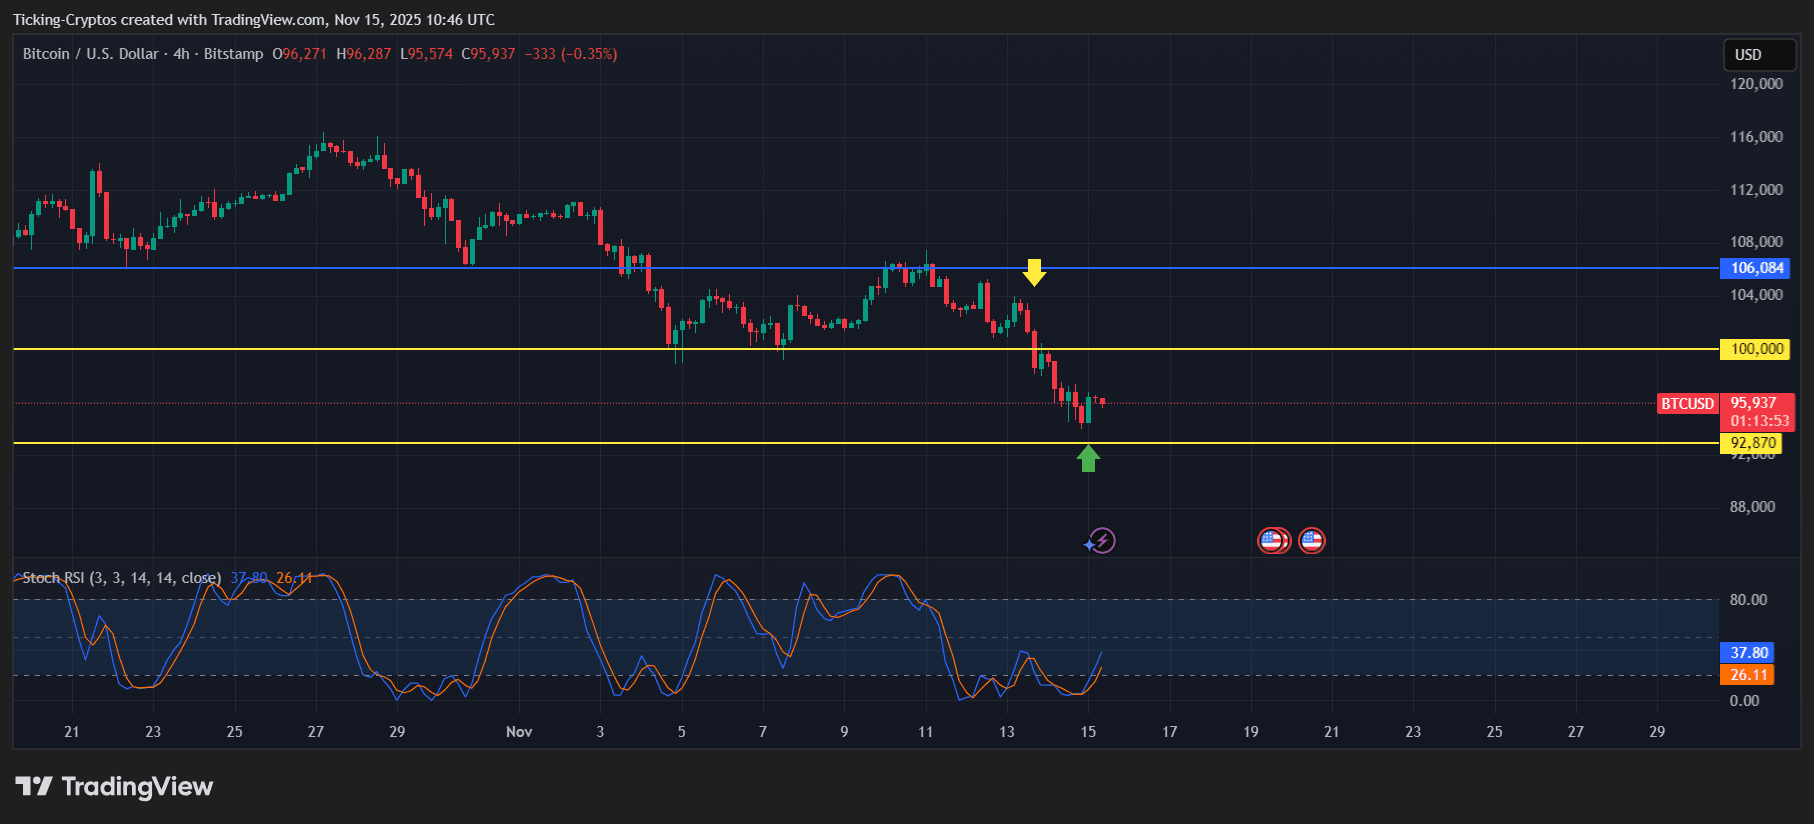
1. Loss of the $100,000 Support
- •Bitcoin has convincingly lost the psychological 100K level.
- •This event triggered a wave of panic selling across the market.
2. Price Hovering Above $92,870 Support
- •This level represents the next major structural support for Bitcoin.
- •The price is currently attempting to stabilize here, but the overall momentum remains bearish.
3. Stoch RSI Signals Potential Bounce
- •The Stoch RSI indicator suggests the possibility of a short-term relief rally.
- •However, without reclaiming higher resistance levels, this bounce is likely to be a temporary reaction rather than a sustained trend reversal.
Bitcoin Price Prediction: Potential Downside Targets
Considering the current trend structure, oversold momentum, and historical fractal patterns, the following price movements are anticipated:
Short-Term Bearish Scenario
If the $92,870 support level is breached:
- •$90,000 is expected to become the next immediate target.
- •A break below $90,000 would likely intensify the ongoing crash.
Medium-Term Downside Targets
- •$88,000
- •$82,000
- •$74,000–$78,000 (identified as a typical deep-cycle bottom zone)
Bullish Reversal Scenario (Currently Less Likely)
A significant recovery is contingent on Bitcoin successfully:
- •Reclaiming the $100,000 level,
- •And subsequently breaking $106,000 with substantial trading volume.
Until these critical levels are regained, the prevailing trend is expected to remain decisively bearish.