

Bitcoin pushed firmly above $91,000 in early trading on November 27, with analysts pointing to a rare momentum setup that historically preceded some of the market’s strongest rallies.
The move comes just days after Bitcoin printed the lowest daily MACD reading ever, a technical extreme highlighted by trader Merlijn The Trader, who compared the current setup to past cycle-defining pivots.
Historic MACD Lows Followed by Explosive Rallies
In the chart shared by Merlijn, every major breakdown in previous cycles was followed by a substantial upward reversal.
- •In 2021, the MACD bottomed at a similar extreme, triggering a +119% rally.
- •In 2025, the indicator has dropped to its lowest point on record, and Bitcoin has already bounced 12% from the bottom.
The visual shows three major dumps during 2024–2025 – 32%, 31%, and 36% – each followed by sharp recoveries. The current MACD compression mirrors the exact levels that historically marked the start of massive trend reversals.
BITCOIN’S BIGGEST PUMPS STARTED RIGHT HERE.
Every major dump was followed by a massive reversal.
2021: MACD bottomed. +119% pump.
2025: Lowest daily MACD ever. Already up 12% from the bottomHistory says this is just the beginning. pic.twitter.com/Um1OUVEC5h
— Merlijn The Trader (@MerlijnTrader) November 27, 2025
Merlijn notes: “History says this is just the beginning.”
Market Conditions Still Bearish, but Momentum Is Shifting
According to the market metrics chart, Bitcoin is trading at $91,700, with overall sentiment still showing bearish conditions. Volatility remains elevated at 8.89%, and short-term trend indicators (50-day and 200-day SMAs) continue to sit well above the spot price, reflecting the recent deep correction.
Despite this fragile backdrop, the 14-day RSI sits at 39, a neutral-but-recovering zone that aligns with early-stage reversal behavior rather than exhaustion.
BTC Price Action Confirms the Bounce
The TradingView chart shows a clear V-shaped recovery as Bitcoin surged from the mid-$80K region back above $91,000, breaking through short-term resistance. Momentum strengthened sharply after November 26, with the final leg of the move forming a clean vertical climb into the $91K–$91.7K zone.
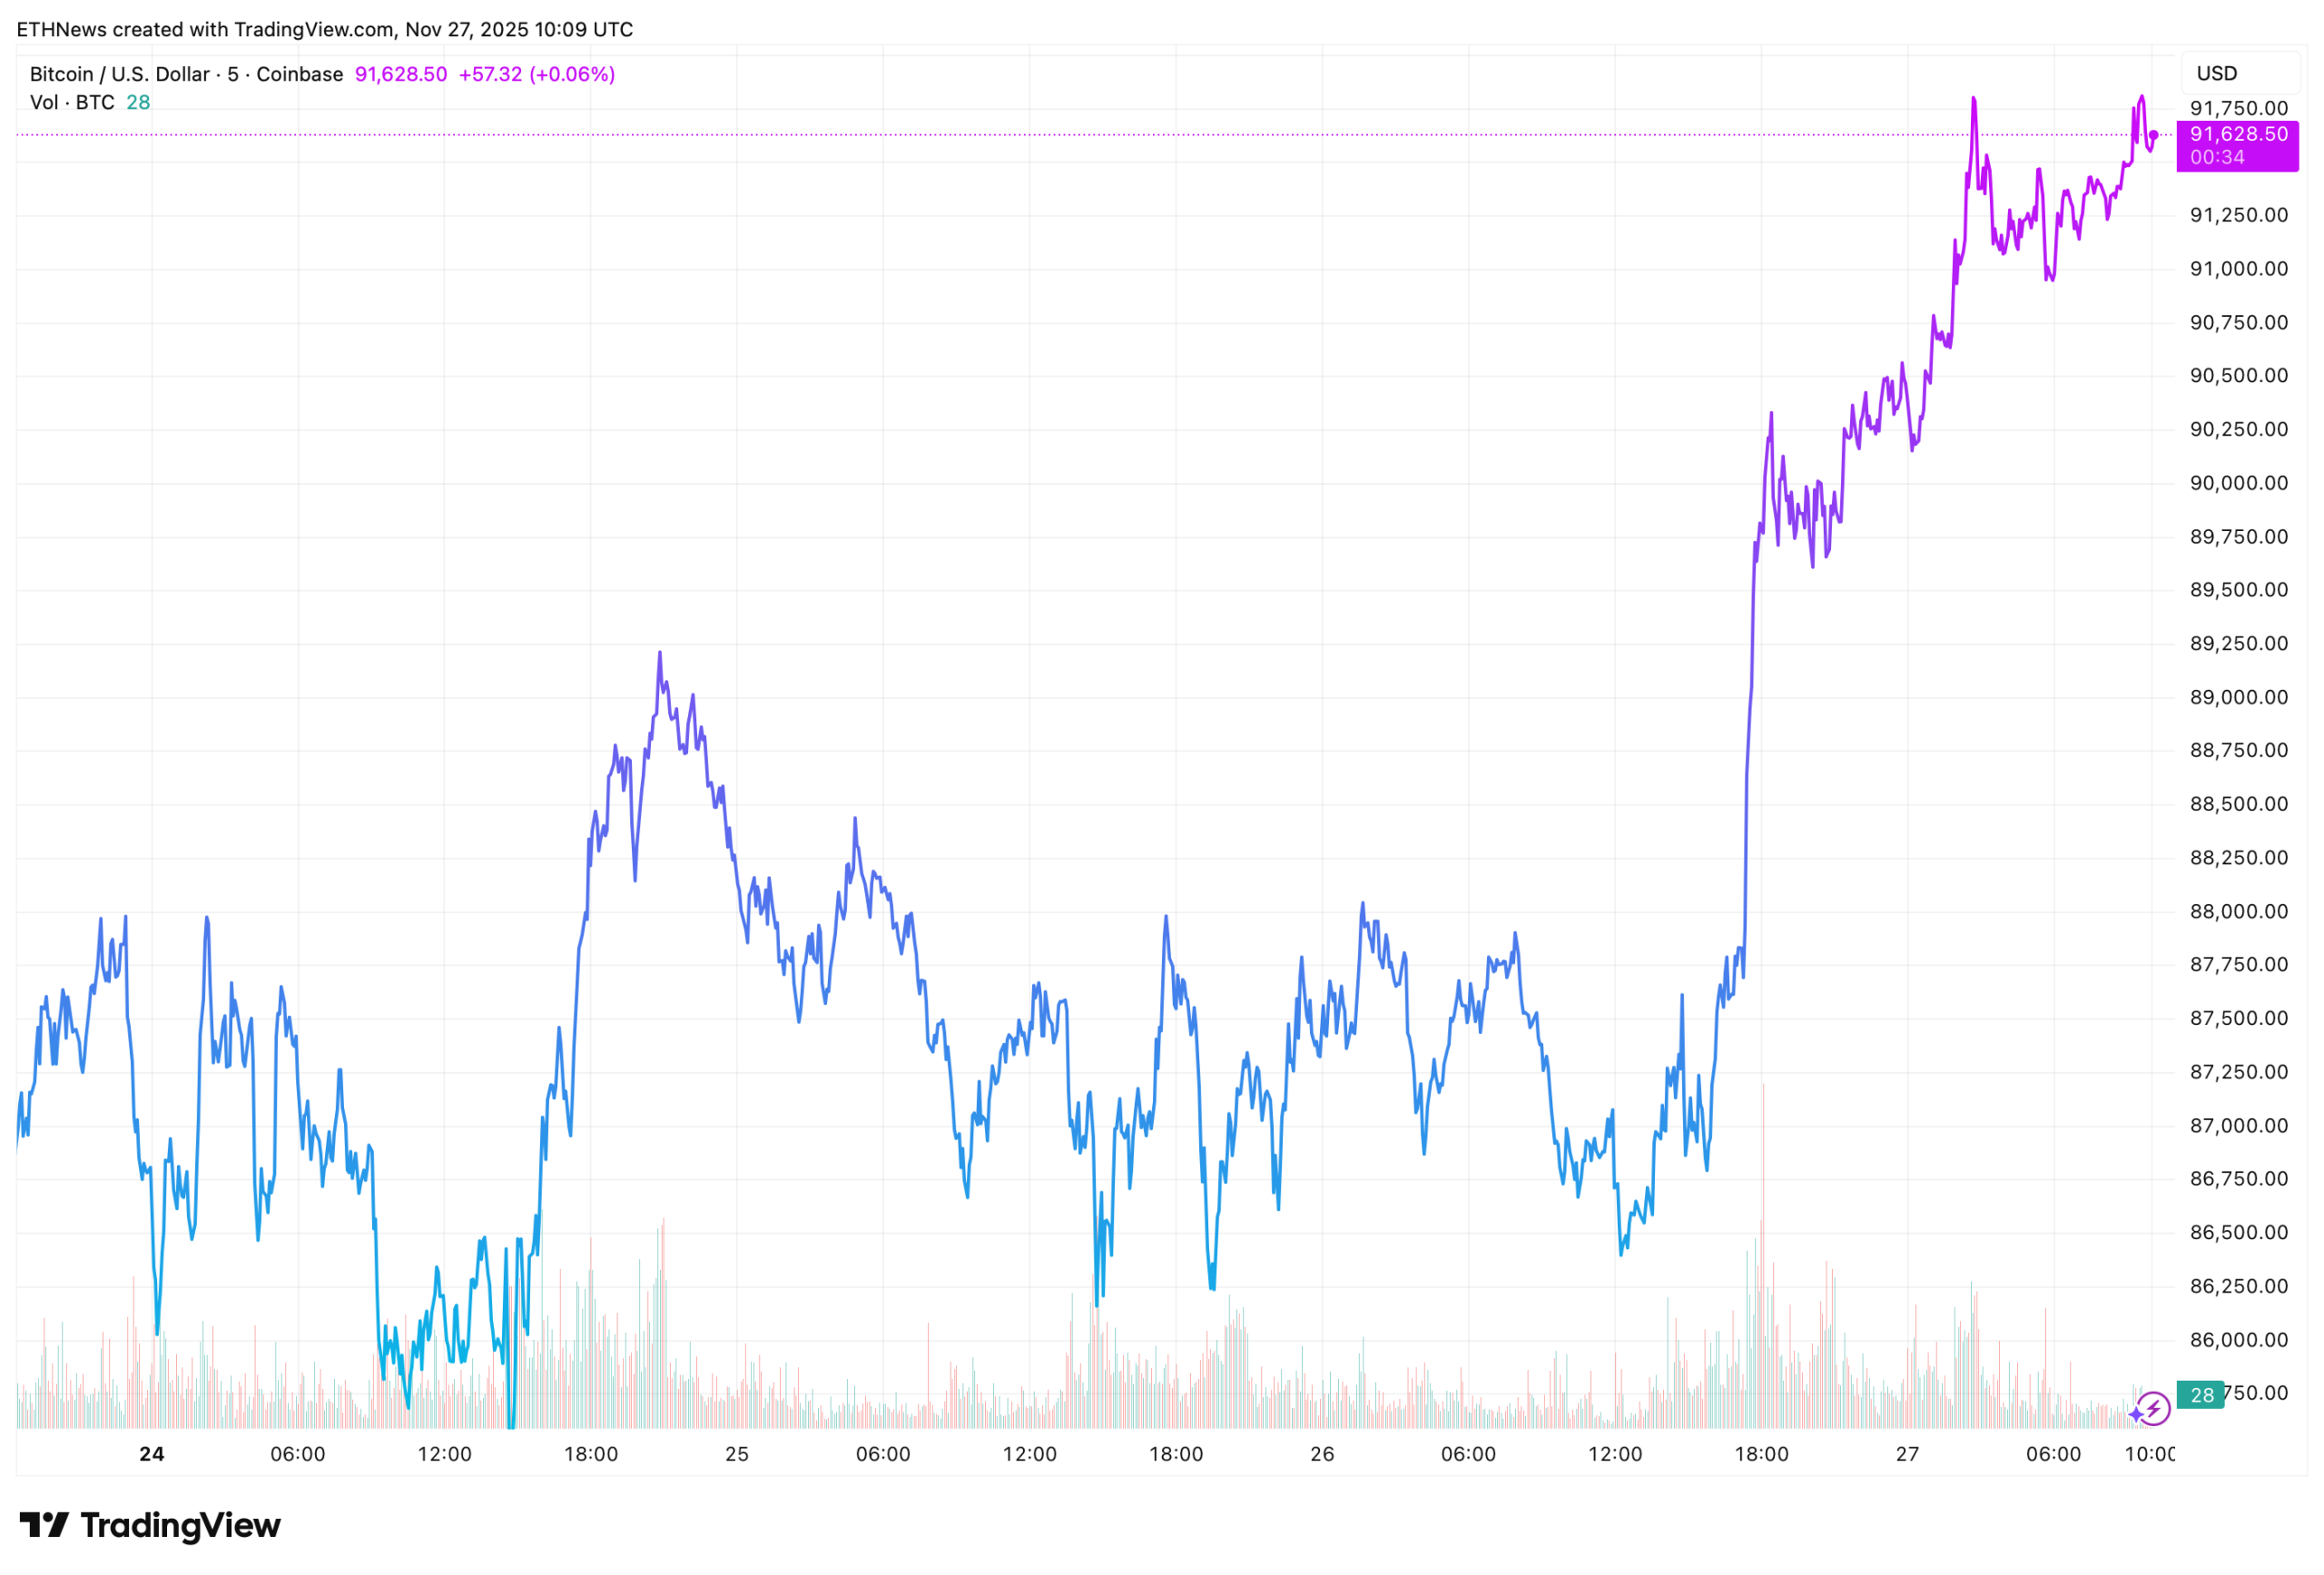
This confirms the technical rebound visible in the MACD analysis. The move above $91K represents one of Bitcoin’s strongest intraday recoveries in recent weeks.
What the Charts Signal Now
Across all three visuals, the shared message is clear:
- •Bitcoin printed its lowest MACD level ever
- •Historically, such readings preceded triple-digit rallies
- •BTC has already rebounded 12% from the MACD bottom
- •Price has now broken above $91K, validating the bounce
- •Momentum is improving despite sentiment still showing “bearish”
The combination of a deep momentum reset, a strong intraday reversal, and a decisive break above $91K paints a picture of a market potentially transitioning out of its recent correction.