

Key Insights
- •Bitcoin bounced at the $88,000 level but must reclaim $90,000 to avoid a potential drop back to $84,000.
- •On-chain data indicates weaker capital inflows as the price climbs, a pattern reminiscent of 2021.
- •The $86,000–$87,500 range is a critical support zone; losing it could lead to further downside.
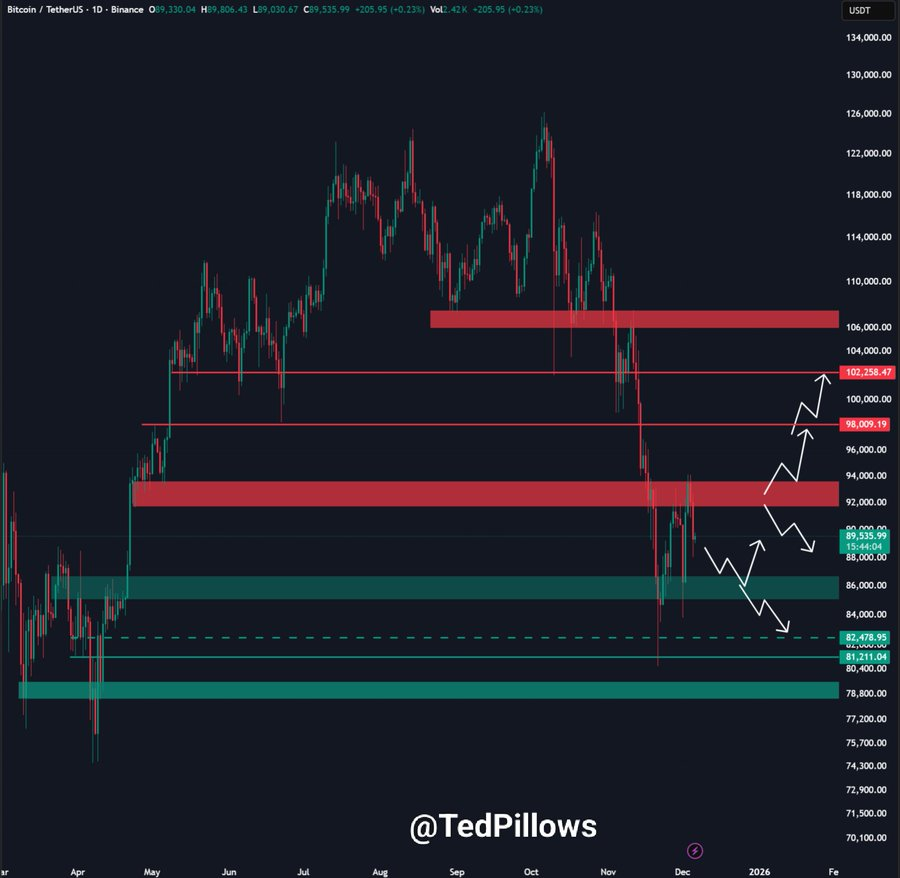
Bitcoin experienced a bounce at the $88,000 level after encountering resistance near $93,000 to $95,000. The cryptocurrency was trading around $89,587.88, following a weekly decrease of 1.2% and a daily loss of 2.1%.
Analysis from Ted indicates that $90,000 is a crucial level. To see further upside, Bitcoin needs to reclaim this price point. Should this level be breached, the next potential resistance areas to monitor are around $92,000 and $94,000, zones that have previously seen selling pressure. Conversely, if Bitcoin remains below $90,000, it could retreat to the $87,000–$88,000 range.
Support Zone at $86K–$87.5K Remains in Focus
Crypto candy highlighted that Bitcoin saw a decline close to the $86,000–$87,500 range following the rejection from recent highs. This area is currently acting as a support zone. According to the analysis, if the $86,000–$87,500 zone holds, Bitcoin might retest the $93,000–$95,000 levels or even reach higher. A break below this support range, however, could trigger further selling pressure.
The accompanying chart illustrates price reactions near this support level. A breakdown below this zone could open the door for declines to deeper levels, such as $84,000 or $82,000. These previous areas of strong buying interest could potentially serve as buffers if the price continues to fall.
Data Shows Slowing Capital Inflows Into BTC
On-chain data suggests a weakening trend in capital inflows into Bitcoin. A chart shared by Ali Martinez, based on Glassnode data, reveals that inflow peaks are declining even as the price continues to ascend. This pattern is comparable to the conditions observed prior to the 2021 market correction. The data indicates that capital flowing into Bitcoin is progressively decreasing, forming lower highs despite the upward price movement.
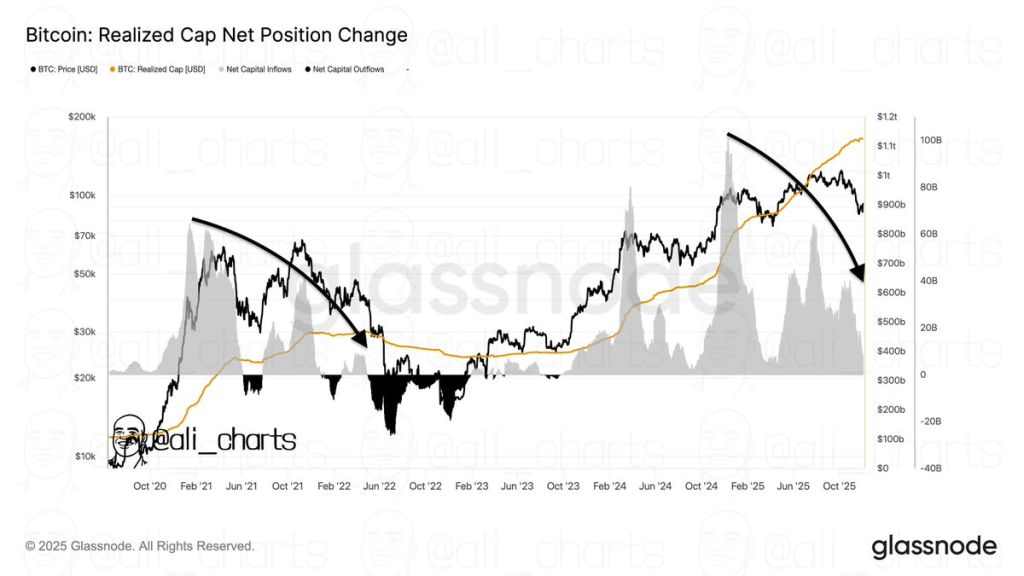
The same analysis shows that while the realized cap is still increasing, its growth rate is not as robust as in previous periods. This implies that although coins are being moved, the velocity of these movements has slowed. The diminishing inflows suggest that the influx of new capital into the market is decelerating, a trend that preceded Bitcoin's previous significant downturns.
Key Levels May Decide Bitcoin’s Next Move
Bitcoin is currently positioned between critical price zones. A decisive move above $90,000 could potentially ignite a short-term rally. If this upward momentum falters, the price might revisit the $87,000–$88,000 area. A failure to hold this support level could lead to further declines, potentially testing levels closer to $84,000. Concurrently, the observed slowdown in capital inflows adds to the prevailing downward pressure. Traders are closely monitoring both price action and on-chain metrics to determine the market's next direction.