
Bitcoin Price Action and Technical Indicators
Bitcoin has reclaimed the $89,000 level after experiencing a rebound from a support zone near $80,685. This upward movement followed a precise touch of the falling wedge's lower boundary, a pattern that has characterized the entire price decline since early November. The Bitcoin price initially surpassed the 23.6% Fibonacci retracement level at $89,114. However, this breakout proved to be short-lived, with Bitcoin retreating to approximately $87,000 at the time of reporting.
The technical chart indicates significant resistance above the current trading range. The 38.2% Fibonacci level is situated at $94,328, while the 50% Fibonacci level stands at $98,542. Higher resistance zones extend across $102,757 and $108,757. These levels are located within a broader supply block that previously rejected price movements throughout September. The overall structure suggests continued selling pressure as BTC has remained within the wedge pattern during the entire decline experienced in November.
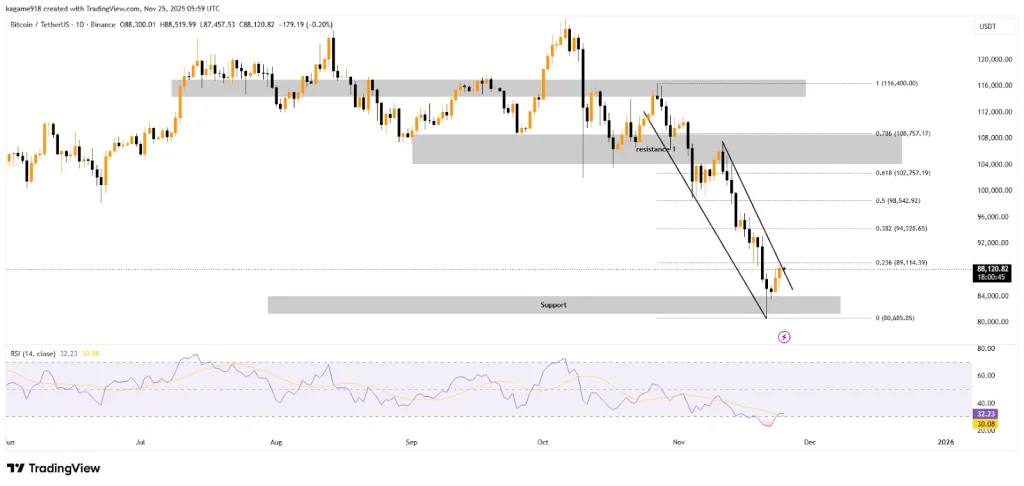
The daily Relative Strength Index (RSI) is currently at a reading of 32.23, placing it just above the oversold threshold. This suggests that bearish momentum remains dominant but may be approaching exhaustion. If the RSI continues to hover near or below this zone, it could indicate that sellers are losing strength, thereby increasing the probability of a short-term relief bounce.
Sharpe Ratio Signals a High-Risk, High-Reward Phase
The Bitcoin Sharpe Ratio has returned to structurally depressed levels, nearing zero. This shift is consistent with conditions observed in 2019, 2020, and 2022. According to a CryptoQuant analyst, MorenoDV, these historical periods often preceded the formation of multi-month trends.
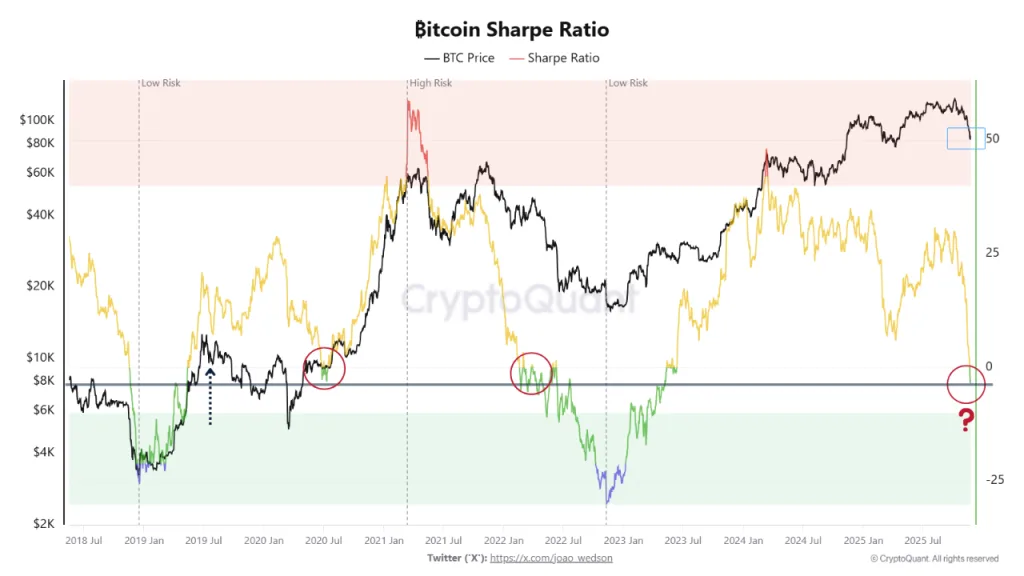
Investors are closely monitoring this phase because these low-Sharpe conditions have historically offered better long-term risk-adjusted setups. The underlying mathematics of these periods reflect an improved potential for future returns if volatility stabilizes. However, the market requires clearer directional signals before broader investor positioning can be established.
The analyst further noted that these phases do not guarantee market bottoms. Nevertheless, the shift in risk-adjusted quality marks a point where investors begin to evaluate structured entry strategies. The market remains sensitive to short-term fluctuations, making carefully sized strategies essential.
Capitulation Metric Surges to a Multi-Year Peak
Bitcoin has entered a severe stress zone, with the capitulation metric surging close to 25 trillion. This represents the highest level observed since early 2020. The price also experienced a sharp fall from the $110,000 region toward the $90,000 area, and the chart displays repeated capitulation spikes across 2024 and 2025.
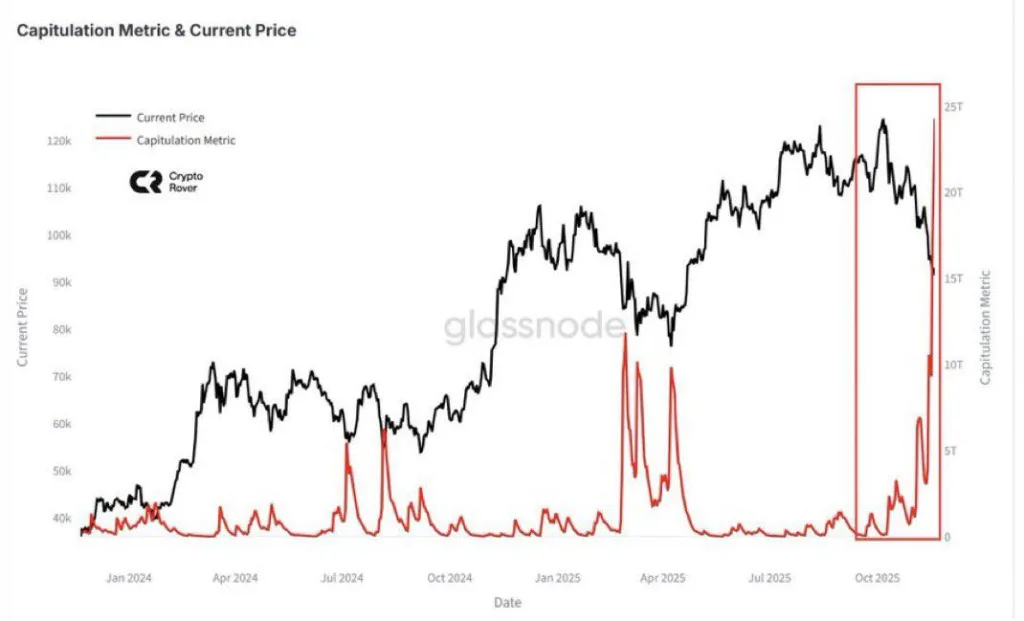
Analyst Rose indicated, based on Glassnode data, that investor buying activity has reached its lowest point. Rose stated that this pattern is comparable to conditions seen during the COVID-19 crash and the FTX collapse. The red capitulation metric, which moved near zero before surging above 20 trillion, confirmed widespread loss-based selling.
Historical data suggests that significant red spikes frequently precede market bottoms. Examples from July 2024, April 2025, and October 2025 correspond with periods of deep fear. These areas saw increased buyer participation as weaker holders were forced out of the market. The current value of approximately 25 trillion raises the key question circulating in the market: Can Bitcoin reclaim over $89,000?