

According to CryptoQuant data shared by CryptosRUs, Bitcoin has re-entered its “oversold” zone, a condition that historically preceded major market rebounds. The 90-day Realized Price Gradient Oscillator has dropped to -1.27 standard deviations (STDV), meaning Bitcoin’s price has fallen well below its short-term cost basis, a sign of heavy selling pressure and potential exhaustion among traders.
Historically, this indicator has been a reliable measure of cycle bottoms. When the oscillator dipped below -1, it often marked the late phase of a correction or the formation of a local bottom.
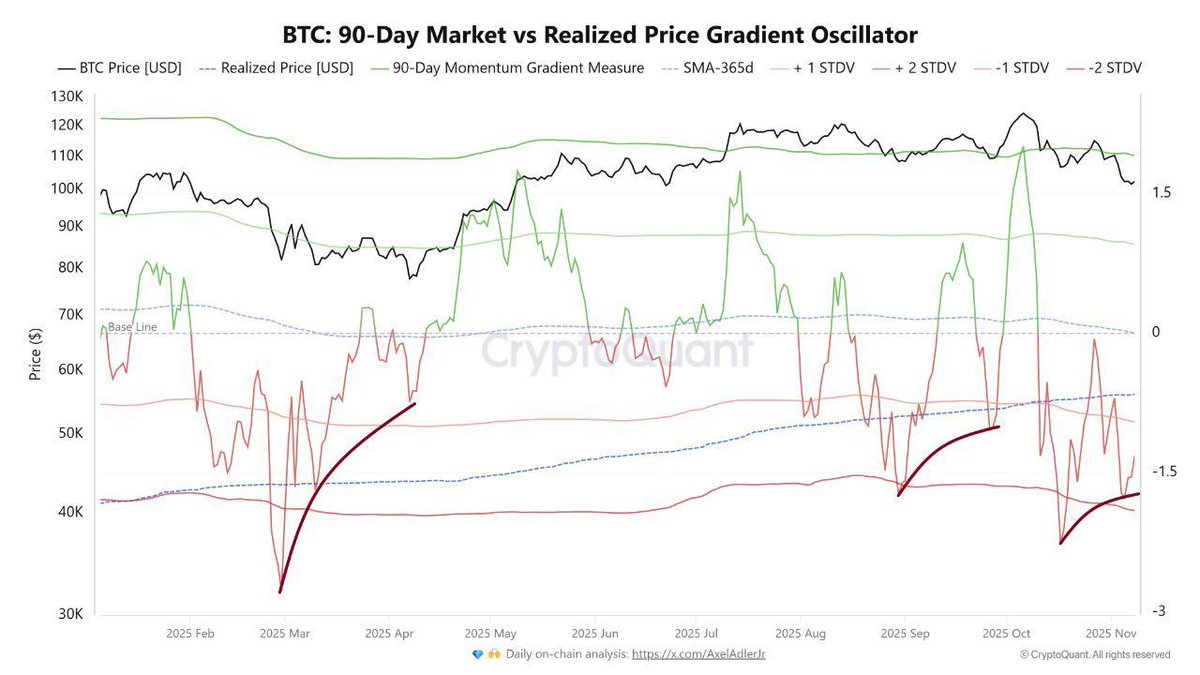
Past Patterns Suggest Possible Recovery
Data shows that during previous drops of this magnitude, Bitcoin staged notable rebounds:
- •After dipping below -1 in early 2025, BTC surged from $82K to $110K.
- •A similar setup later led to a rally from $108K to $124K.
Now, with the oscillator once again beneath the -1 threshold, the pattern appears to be repeating. Analysts suggest that this could indicate a near-term bottom formation, though not necessarily an immediate reversal.
Sellers Losing Momentum
The market’s downside momentum has been slowing, with selling pressure easing after weeks of correction from Bitcoin’s peak near $110K. Historically, such phases of seller fatigue have often aligned with accumulation periods by long-term holders, setting the stage for a rebound.
CryptosRUs noted that while this doesn’t guarantee a bottom, the technical setup mirrors prior recovery zones: price stretched to the downside, sellers retreating, and volatility compressing.
“Just watching the signal, not the noise,” the post concluded, reinforcing the focus on macro indicators rather than short-term panic.