

Key Takeaways
- •Bitcoin is consolidating in a descending wedge, historically a bullish reversal pattern, according to Crypto Rover.
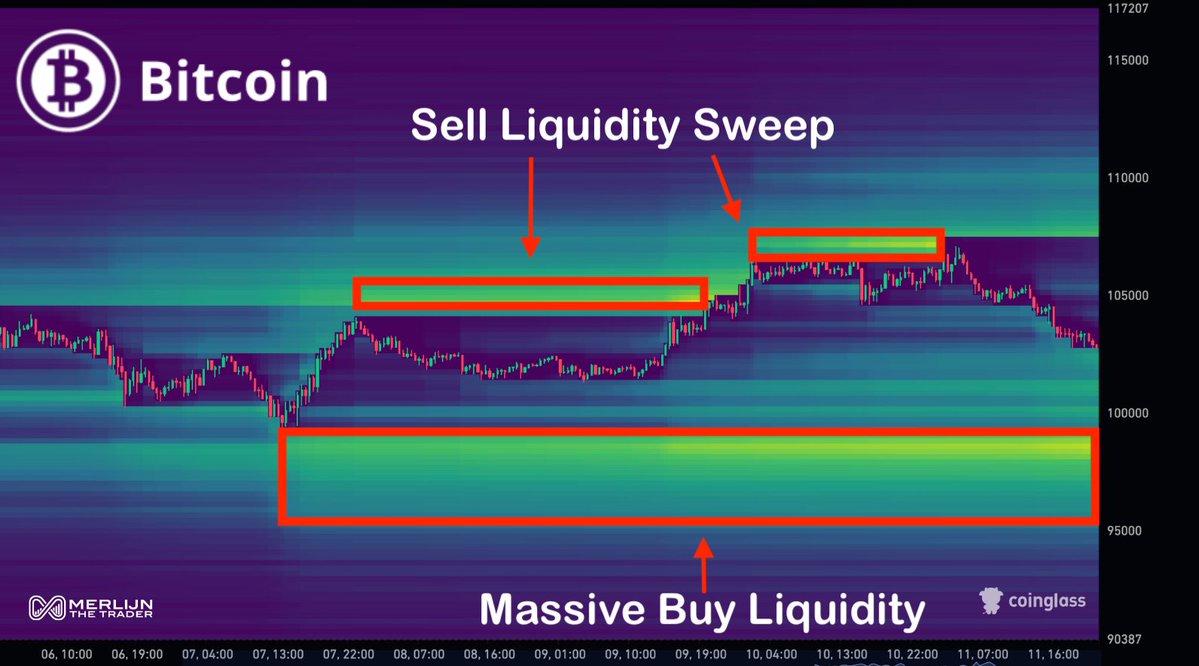
- •On-chain heatmaps show heavy buy liquidity between $95K and $98K, signaling potential for one final flush before a rebound.
- •A Satoshi-era wallet sold $1.5 billion in Bitcoin, marking one of the largest historic old-wallet liquidations.
- •BTC has just touched its 365-day moving average, a level that previously triggered 66–100% rallies, Coin Bureau notes.
Bitcoin is once again approaching a critical technical inflection point. As shown by trader Crypto Rover, BTC is compressing within a falling wedge formation, a pattern that often precedes strong upward breakouts. The structure, defined by lower highs and higher lows, suggests volatility could soon expand after several weeks of consolidation near the $102,000–$104,000 range.
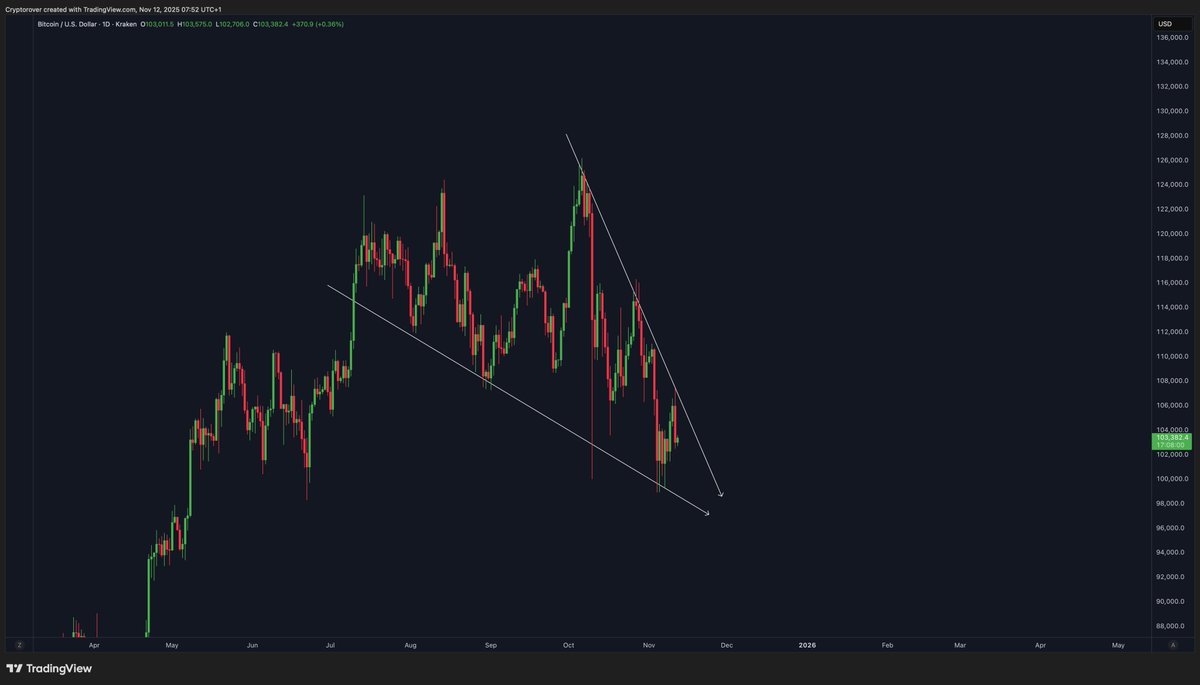
Historically, similar setups in mid-2023 and early 2024 have preceded major upside reversals once momentum confirmed above the wedge’s upper boundary.
Liquidity Map Reveals Final Flush Potential
Trader Merlijn The Trader provided further context through a Bitcoin liquidity heatmap, revealing two key clusters shaping the current market:
- •Sell-side liquidity concentrated around $110,000–$115,000, representing trapped short-term longs.
- •Buy-side liquidity glowing heavily between $95,000–$98,000, where deep bids remain positioned.
Merlijn emphasized that the setup doesn’t imply bearish sentiment; instead, it reflects a liquidity-driven structure that could allow for one more downside sweep before reclaiming higher levels. “Don’t be surprised by one final flush,” he cautioned, suggesting that whales may drive price volatility to absorb liquidity before an upward reversal.
Historic Wallet Movement Adds Market Pressure
Adding to the week’s volatility narrative, Bitcoinsensus reported that a Satoshi-era Bitcoin wallet, untouched since 2010, recently sold its entire balance, valued at $1.5 billion.
The wallet’s movement, visible on Arkham Intelligence, shows complete liquidation of over 12,000 BTC accumulated more than 15 years ago. Analysts note that such sales are rare and tend to capture market attention, as early holders often represent “diamond hands” from Bitcoin’s earliest era.
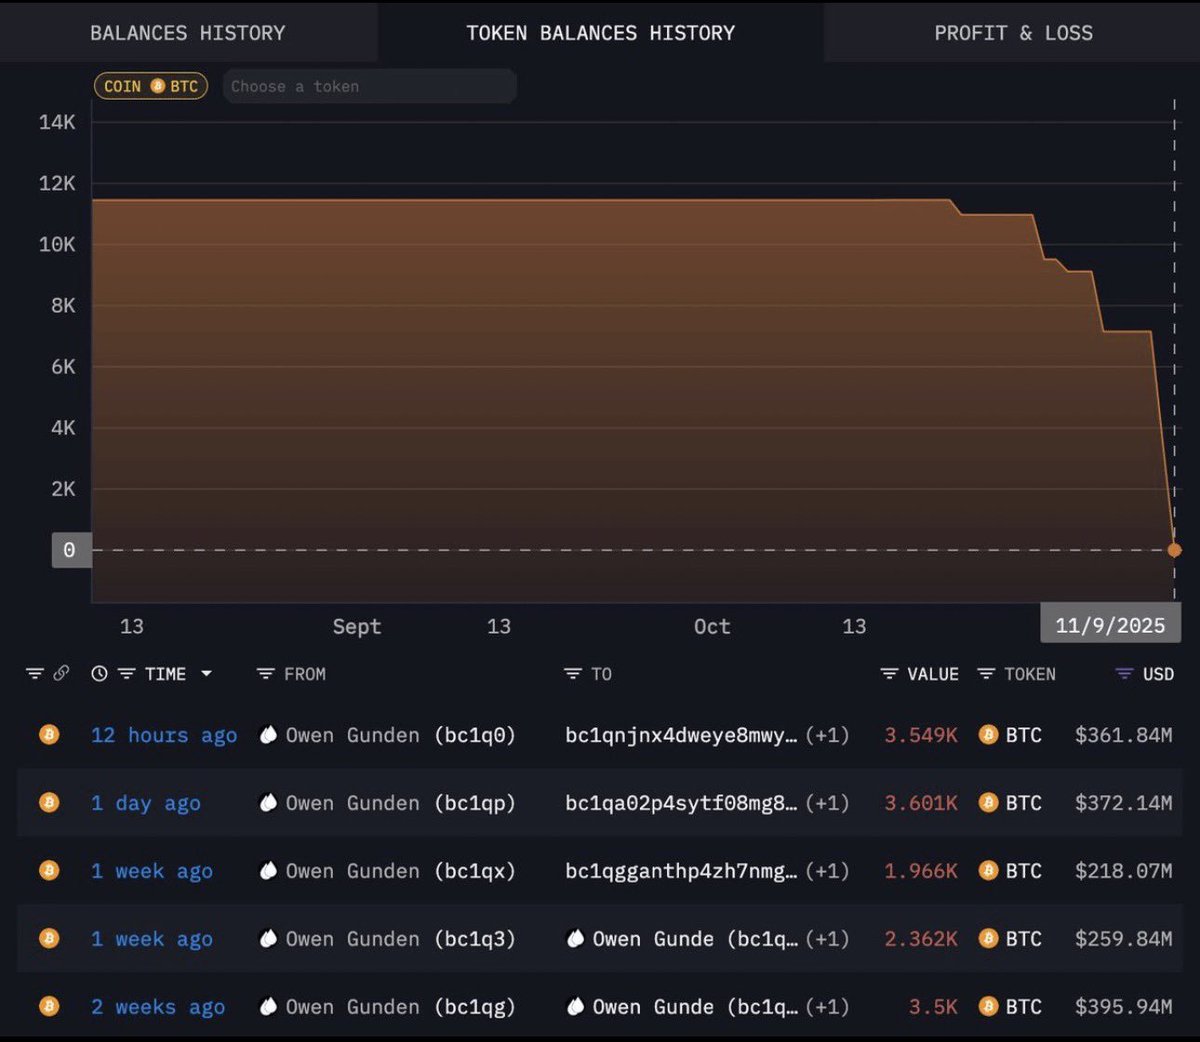
While the transaction briefly spooked traders, on-chain data indicates most of the liquidity was absorbed efficiently, reinforcing the depth of Bitcoin’s current market structure.
Key Moving Average Could Trigger Next Rally
In a separate analysis, Coin Bureau highlighted Bitcoin’s proximity to its 365-day simple moving average (SMA), a historically significant technical level.
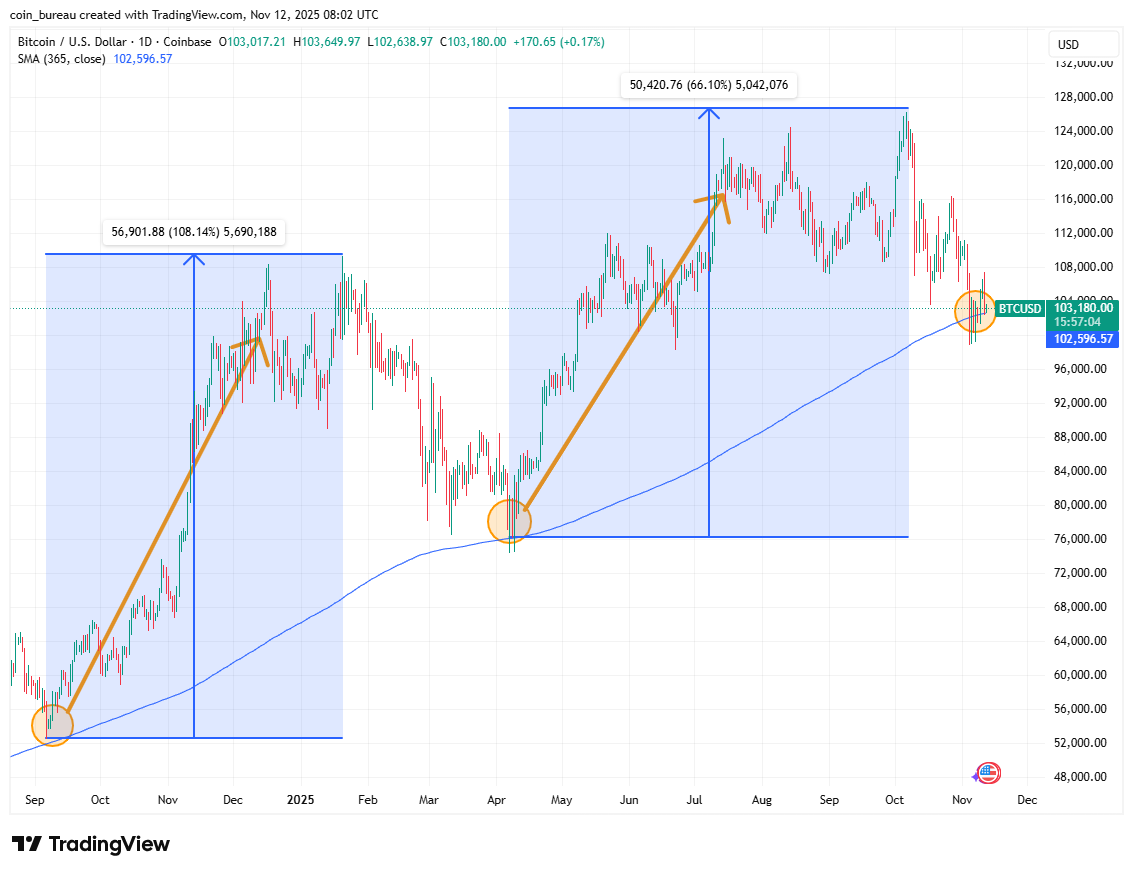
BTC has now touched this trendline at around $102,500, the same level that previously triggered +100% rallies in November 2024 and +66% gains in April 2025. Coin Bureau argues that if the pattern repeats, Bitcoin could target the $200,000 mark in the coming macro cycle.
The analyst noted that BTC’s alignment with its 1-year SMA often signals market equilibrium, a zone where long-term holders re-enter and supply tightens ahead of upward expansions.
Market Outlook: Compression Before Expansion
With multiple technical indicators aligning, traders see Bitcoin entering a “compression before expansion” phase. The wedge formation, combined with heatmap data and liquidity clusters, points to a potential breakout window before year-end.
If BTC holds above $95,000 and reclaims the $106,000 resistance zone, analysts suggest the move could evolve into a new macro rally phase, one supported by historical moving average patterns and strong underlying demand.
Despite short-term uncertainty, market positioning continues to favor the upside as institutional accumulation deepens and long-term holders maintain conviction.