

Key Observations on AVAX Price Action
- •AVAX is approaching the $11–$8 zone, with its chart indicating extended weakness and narrowing volatility.
- •Wolfe Wave signals are reappearing as the token tests major trendline pressure following a year-long decline.
- •Market activity is increasing despite price compression, suggesting reactive positioning among traders.
AVAX price action shows the token trading near its lowest trading band of 2025, while the market structure continues to compress. The chart reflects a cautious environment, with extended downward pressure shaping sentiment across higher timeframes.
Wolfe Wave Structure Develops Near Major Levels
AVAX is forming a Wolfe Wave pattern that bears resemblance to a structure observed in September 2023. This formation is appearing near the lower boundary of its broader descending channel, an area where past cycles have frequently initiated recovery attempts.
Analysis from BeLaunch indicates that AVAX is entering the final leg of this Wolfe Wave pattern. This region is characterized by tightened volatility and prolonged selling pressure that has persisted throughout the year.
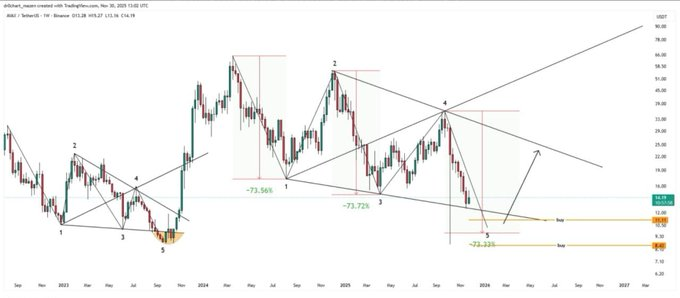
Currently trading around $12.92, AVAX is positioned close to the $11–$8 accumulation range previously identified in the analysis. This zone has historically served as a structural base during previous cycles and is closely monitored by long-term market participants.
Downtrend Extends Through 2025 Price Action
The broader AVAX chart illustrates a controlled decline exceeding 70% from early-year levels. Each rally attempt has ultimately reverted to the descending trajectory, confirming the persistent control of sellers in the market.

Attempts to reclaim the $30 region in September were met with sharp rejections. This price movement reinforced the long-term bearish structure and signaled a lack of buyer momentum in the face of prevailing market conditions.
A recent increase in trading volume by 49% accompanied an 8% decline in market capitalization. This activity suggests increased repositioning rather than sustained accumulation by investors.
Support Erosion and Market Behavior
Support areas situated between $15 and $18 experienced weakening after repeated tests throughout the year. This breakdown has driven AVAX towards its current trading zone, where price action exhibits compression and diminished momentum.
The introduction of Bitwise’s AVAX ETF ($BAVA) brought a new discussion point concerning staking yields. Despite this fundamental development, price movement has not demonstrated a strong reaction, indicating that structural factors continue to exert dominance over the market.
With 429 million AVAX circulating and a total supply nearing 460 million, the current price decline reflects valuation pressure rather than supply expansion. Traders are now observing whether the Wolfe Wave pattern completes near the identified accumulation levels before any broader structural shift takes place.