

Avalanche is trading under heavy strain after a clean breakdown from a right-angled ascending broadening wedge, a structure that has defined its multi-month trend.
Ali Martinez’s latest analysis highlights how the wedge’s upper boundary rejected AVAX throughout 2025 before price finally lost its lower trendline, a move that typically signals prolonged downside pressure.
A Decisive Pattern Break Sets the Tone
The chart shows a clear pattern failure: AVAX slid beneath the wedge’s base and retested it as resistance, confirming the breakdown. The structure widens over time, reflecting increasingly volatile swings, and the loss of its support level removes a major technical anchor.
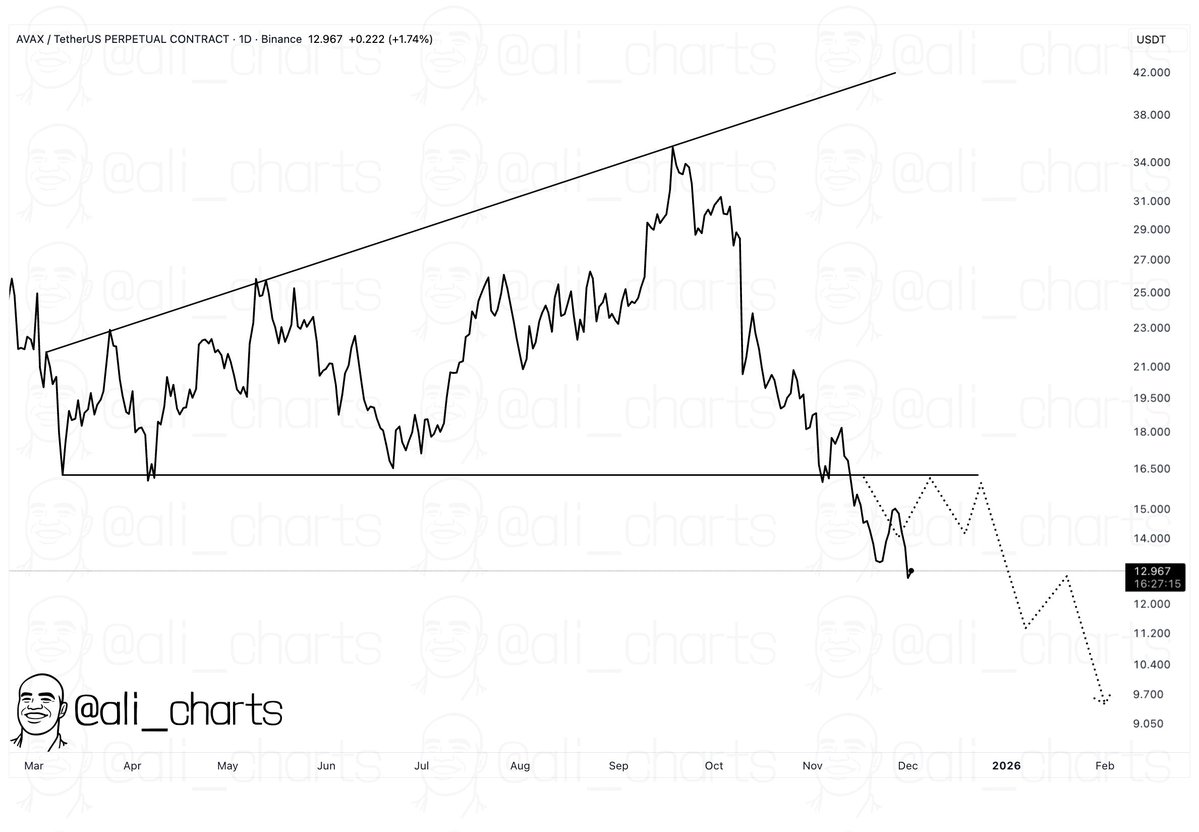
Ali’s projected path outlines stepped declines toward the $12, $11, and potentially $10 regions before the broader structure allows for any stabilization. His schematic also visualizes lower-high formations extending into early 2026, emphasizing a sustained bearish trend.
Market Reaction Reinforces the Bearish Setup
The intraday AVAX chart reveals how momentum weakened sharply after the late-November rally. The data indicates a failed continuation attempt above $15, followed by a steep selloff that drove price into the mid-$12 zone. Trading volume expanded on the downturn, reinforcing sellers’ control.
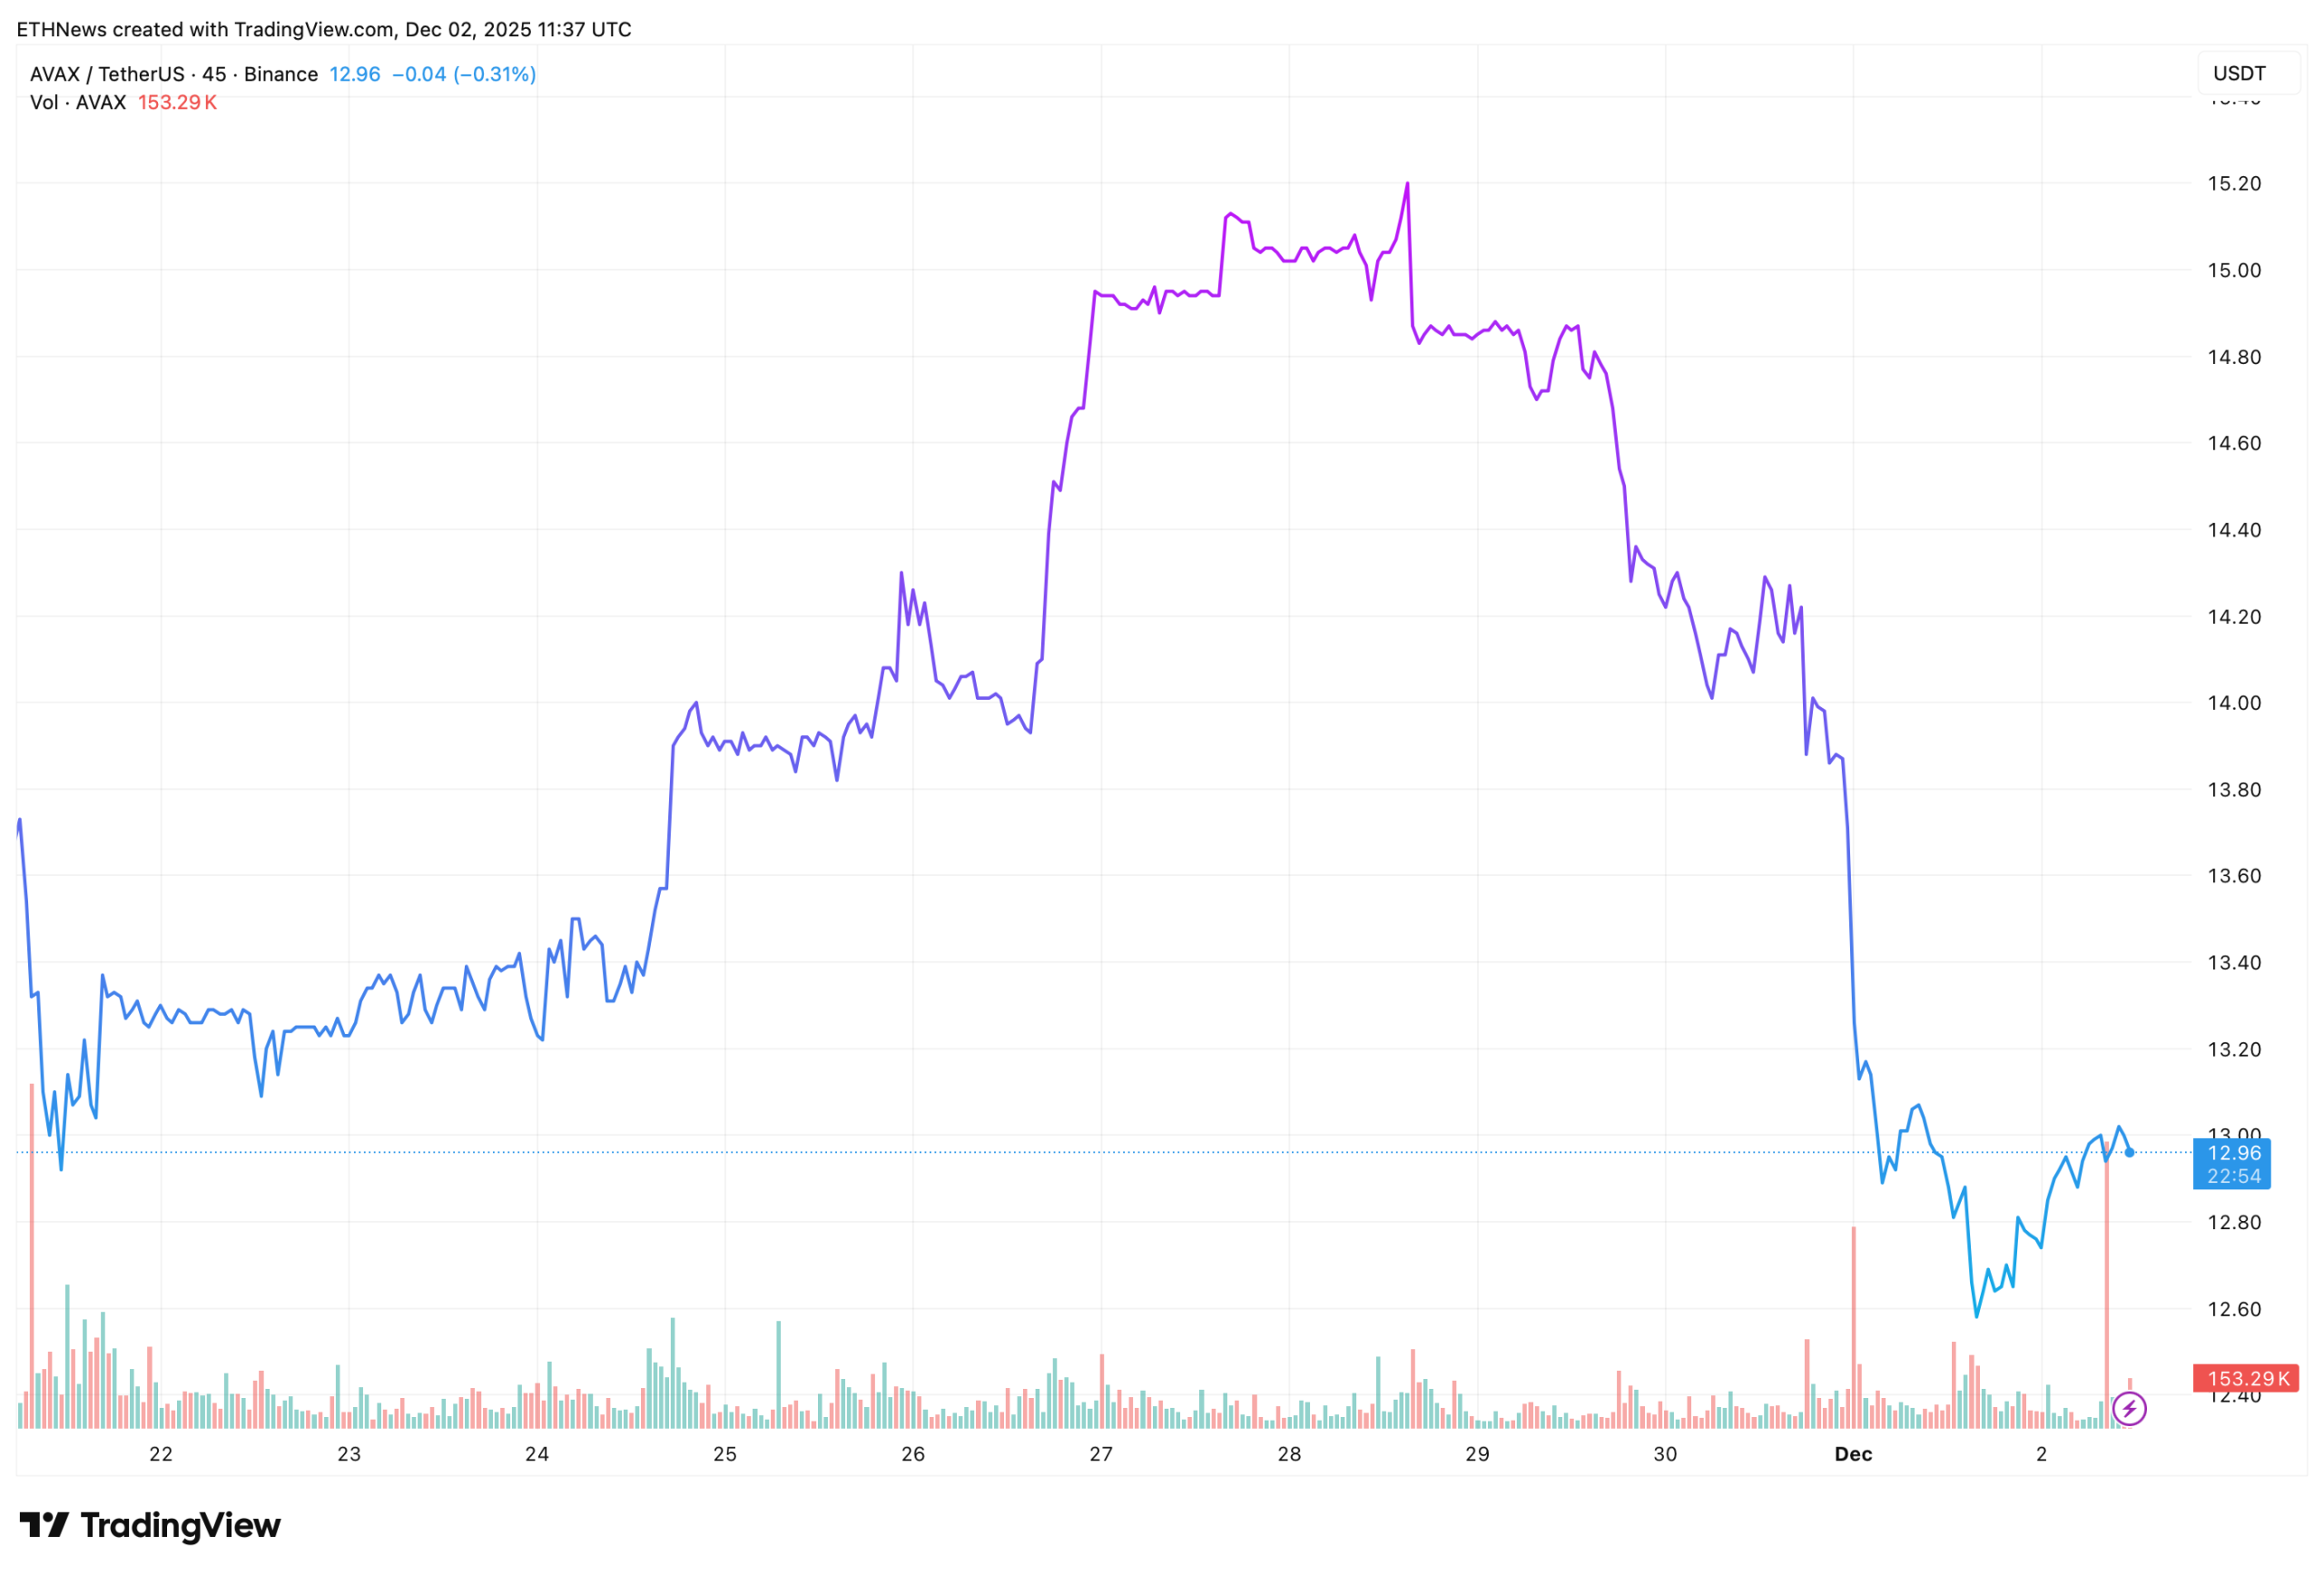
The graphic also highlights how short-lived recovery attempts have been. Every bounce stalled below prior support levels, a characteristic of markets that shift from distribution into trending declines.
On-Chain and Technical Metrics Lean to the Downside
Fresh AVAX indicators add more weight to the bearish narrative:
- •Current price: $13
- •Volatility: 10.39% (very high) – conditions that often accelerate pattern-based moves
- •14-day RSI: 31.23 (neutral but approaching oversold)
- •50-day SMA: $17.31, well above spot price and signaling persistent downside momentum
- •200-day SMA: $22.29, confirming the broader trend remains firmly bearish
The metrics show a wide gap between the current price and long-term averages, underscoring the severity of the downtrend. The market is operating under high volatility paired with extremely pessimistic sentiment, a combination that often invites deeper price exploration before establishing a durable base.
Avalanche’s Key Levels Into the Coming Weeks
The analysis highlights several near-term zones that may define AVAX’s trajectory:
- •$13.00–$12.50: Initial support area where current consolidation is forming
- •$11.50–$10.40: The next major liquidity pocket if selling resumes
- •$9.00: The target level derived from the wedge structure’s technical implications
The chart suggests AVAX remains vulnerable unless price reclaims former support near $15, which currently acts as overhead resistance.
Avalanche now sits at a pivotal moment. The combination of a confirmed wedge breakdown, weakening momentum, and extreme fear positioning leaves the asset exposed to further downside unless buyers re-establish control at higher levels.