
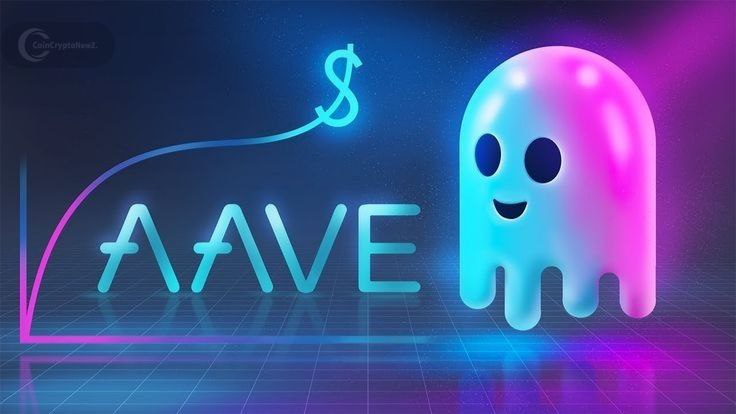
AAVE's price action mirrors a past cycle that delivered massive gains, according to analyst Ali Charts' latest breakdown on X. If the current technical setup holds, AAVE could potentially surge from its current levels toward $125, indicating a significant upside for the decentralized finance (DeFi) asset.
In the volatile world of cryptocurrency, technical analyst Ali Charts has gained respect for his prescient market calls. On November 15, 2025, Ali shared a comparison of AAVE/USDT perpetual futures candlestick charts on X, suggesting a repeating historical pattern. "Tell me this doesn’t look identical… If the pattern holds, $AAVE could be headed straight for $125," he captioned the image, sparking considerable discussion within the crypto community.
Aave (AAVE) is the governance token for a prominent decentralized lending and borrowing platform that has navigated various market conditions since its launch in 2020. With its price currently hovering around $180, AAVE has established itself as a blue-chip asset in the DeFi sector. The platform boasts a total value locked (TVL) exceeding $10 billion, coinciding with growing institutional interest in non-custodial finance.
Technical Analysis: A Historical Parallel
Ali's analysis is based on comparing historical chart patterns, specifically referencing Elliott Wave theory and fractal geometry. The left panel of his chart displays AAVE's historical performance from late 2020 to mid-2021, a period that saw the token experience a parabolic ascent from sub-$50 levels to a peak near $420 before a subsequent correction. During this historical phase, the token consolidated for several months, forming what appears to be an ascending triangle pattern. This pattern was characterized by diminishing volume on downward movements and significant breakouts on upward price action.
The right panel of the chart illustrates AAVE's price action from September 2025 onwards. The resemblance to the earlier pattern is striking. Following a rally to $420 in the third quarter, the token experienced a retracement to lows of $128 in October. It has since been consolidating in a similar base formation, marked by rising lows and a flat resistance level around $200. The volume patterns observed in this recent period align closely with the historical data, suggesting potential accumulation by informed investors.
Potential Price Targets and Market Context
If Ali's fractal analysis proves accurate, a breakout above the $200 level could trigger a significant upward movement. The target price mentioned in the post, $125, appears to be a reference point within the context of the historical pattern's scaling. More specifically, this $125 target likely relates to a proportional Fibonacci extension from the pattern's impulse wave, projecting a 1.618x extension from the prior leg, aiming for a clean $125 target amidst broader altcoin rotation. It's important to note that in a bullish market environment, such price points might represent the next resistance-turned-support level en route to new all-time highs, rather than a definitive downside target.
The timing of this technical alignment is significant, as the total value locked in DeFi has seen a notable surge of 25% year-to-date. This growth is attributed to factors such as the integration of real-world assets (RWAs) and the efficiency improvements brought about by Ethereum's Dencun upgrade, which has reduced transaction fees. Aave's V3 iteration, with its cross-chain functionalities, is well-positioned to attract capital seeking yield opportunities, especially as investors potentially move away from traditional finance amid economic uncertainties.
However, potential risks remain. Macroeconomic factors, such as persistent inflation and Federal Reserve interest rate policies, could influence market sentiment and cap upside potential. Furthermore, on-chain metrics indicate that if the $180 level holds as resistance, there could be distributions from large holders, known as whales.
Conclusion
Ali Charts' prediction is rooted in technical pattern recognition rather than speculative optimism. As Bitcoin shows signs of stabilization following its rise above $100,000, altcoins like AAVE often experience significant upward momentum. Traders are advised to closely monitor the $200 resistance level. A decisive break above this point could signal the beginning of the projected rally, with the $125 level and potentially higher targets coming into play. In the cryptocurrency market, historical patterns can offer valuable insights, but they require conviction from investors to play out.