

AAVE Confirms Structural Breakout on Daily Chart
AAVE confirms a daily upside breakout after months of corrective price action and expanding volatility structure. Liquidation pressure normalized after October flush, signaling leverage reset and healthier derivatives positioning. Open interest and volume concentration show active participation without excessive leverage buildup across major exchanges.
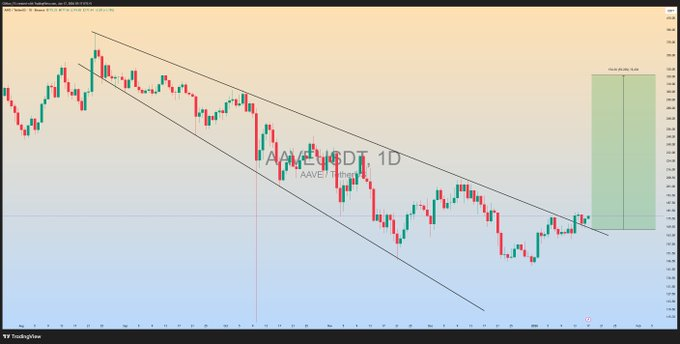
AAVE begins with a confirmed upside breakout from a descending broadening wedge on the daily timeframe. This structure formed after a prolonged decline marked by weakening bearish control and expanding volatility. The breakout invalidates the prior corrective framework that defined recent price behavior. Market structure now reflects a transition toward potential trend expansion rather than continuation of decline.
The previous stage was characterized by repeated declines on a downward resistance curve, which strengthened the bearish control in a series of months. However, volatility increased rather than contracted indicating the lack of agreement between buyers and sellers. These tendencies are usually followed by directional resolution after control changes. The movement above the upper wedge limit indicates the transition at that point.
After the breakout, the price stabilized with the previous resistance being important as a reference level. Acceptance above this area suggests participation rather than rejection. Daily closes above the structure add confirmation to the breakout narrative. This behavior aligns with observations shared publicly by Clifton Fx on social platforms.
Momentum Improvement and Measured Upside Expectations
AAVE also reflects improving swing structure following the breakout. Higher lows have begun forming, reinforcing bullish control without impulsive extensions. The recovery appears orderly, suggesting participation from longer-term market participants. Such price behavior often supports trend durability rather than short-lived rallies.
The projected upside zone is derived from the height of the descending broadening wedge. This measured move aligns with historical volatility observed during AAVE recovery phases. While exact targets remain conditional, the structure supports expectations of an extended bullish phase. The projection reflects recovery potential rather than speculative excess.
Risk remains clearly defined within this setup, centered around the former wedge resistance. Sustained movement below this level would weaken the bullish structure. However, continued respect of this zone supports ongoing continuation. This framework emphasizes confirmation over anticipation, consistent with disciplined technical analysis.
Derivatives Data Shows Stabilization After Leverage Reset
AAVE gains further context from liquidation and derivatives data following the October volatility event. That period saw a sharp spike in long liquidations alongside a sudden price drop. The move flushed overleveraged positions and marked a leverage reset. Price then entered a more orderly consolidation phase.
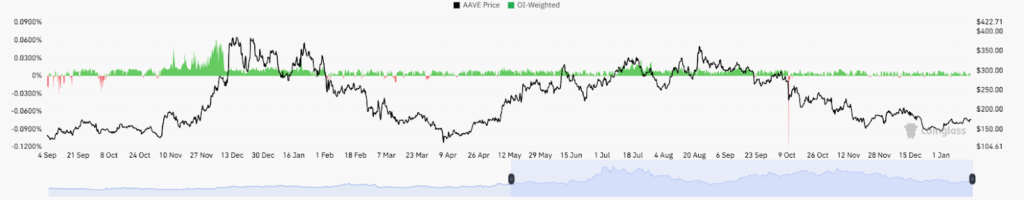
After that event, liquidation activity declined and became more balanced between long and short positions. This shift suggests a cooling derivatives environment with reduced speculative pressure. Open interest remained distributed across major exchanges without extreme concentration. Such conditions often support structurally driven price movement rather than forced volatility.
Volume and trade count data reinforce this view of steady participation. Binance and Bybit lead open interest and volume, while BingX shows elevated trade activity. These metrics indicate active turnover rather than excessive position buildup. Overall, derivatives conditions appear supportive of structurally driven continuation rather than liquidation-led moves.