

Market researcher Ali Martinez has highlighted five distinct sell signals that have appeared within the past month, a rare confluence that historically precedes significant corrections in the cryptocurrency market. These warnings come as Bitcoin trades below $87,000, a notable drop from its recent all-time high. While not every signal guarantees further price depreciation, the sheer volume of bearish indicators has sparked considerable discussion about whether the current market movement is merely a mid-cycle reset or the commencement of a more substantial downturn.
Key Support Levels at Risk
Models that track Bitcoin's MVRV deviation pricing bands identify three critical support levels that could cushion the market should the correction deepen. These levels are $75,740, $56,160, and $52,820. A failure to hold the initial threshold of $75,740 could expose the market to a much broader retracement than many traders currently anticipate following the recent rally.
Bi-Monthly TD Sequential Indicator Flashes Sell Signal
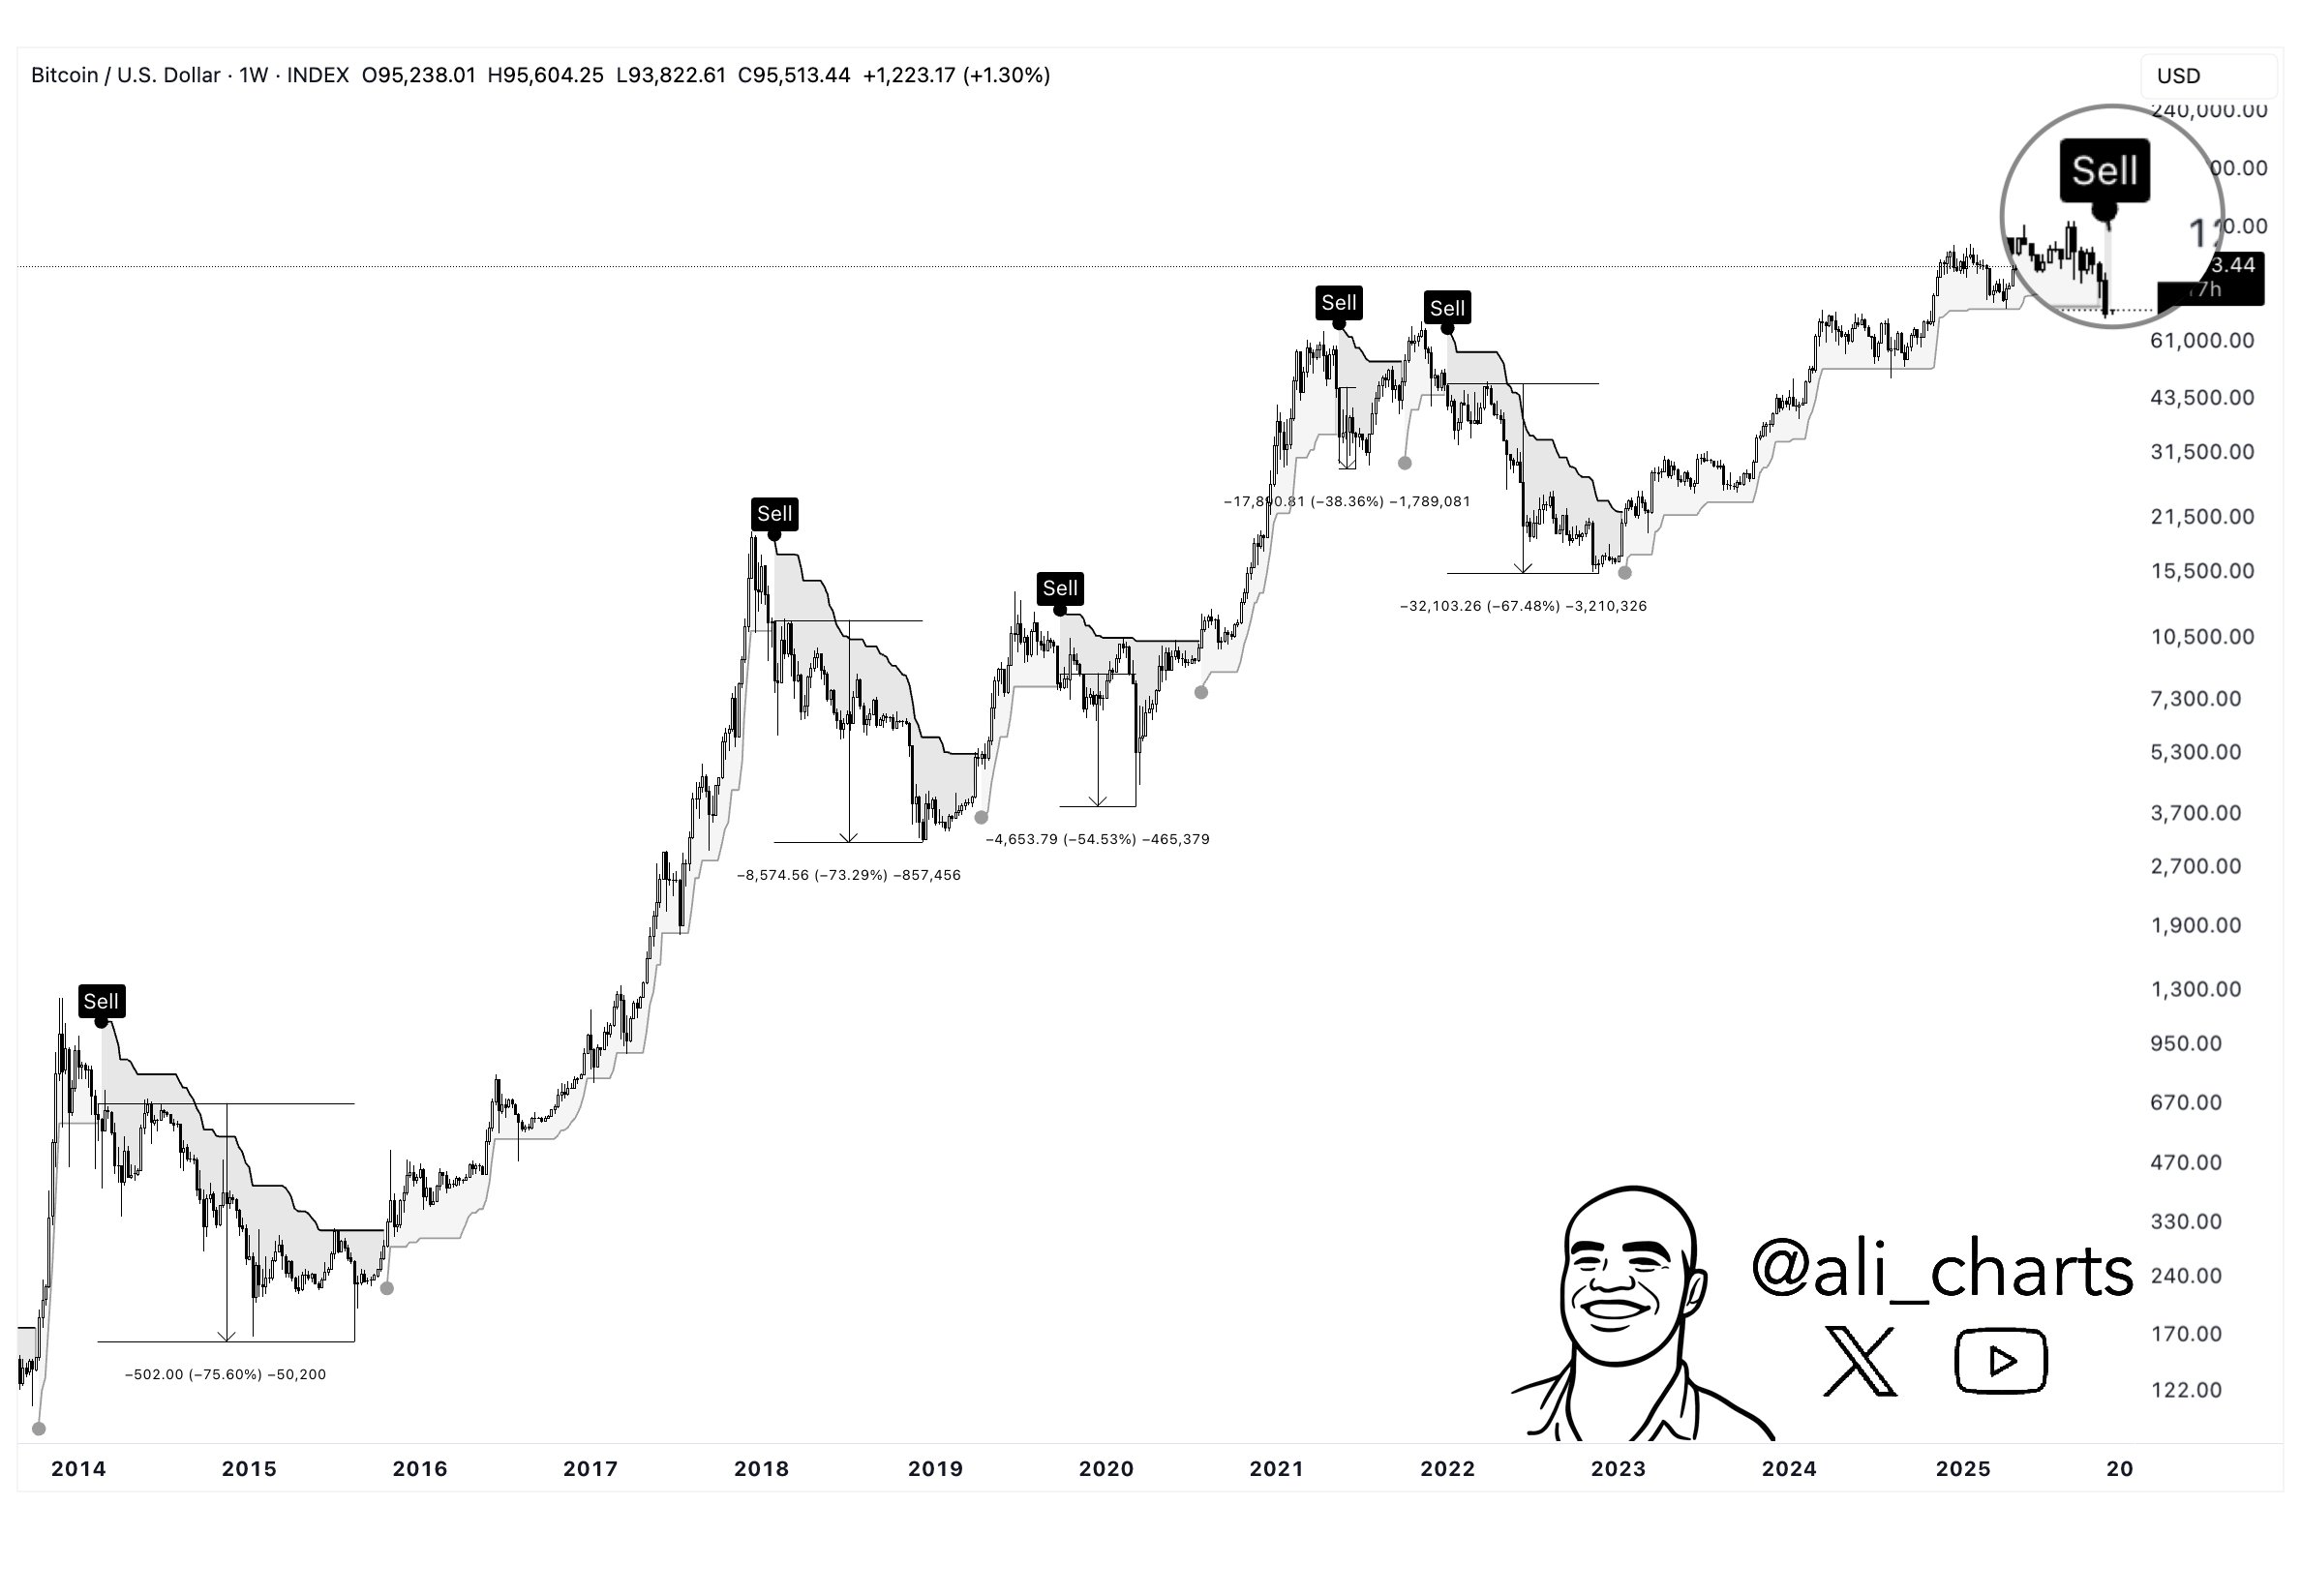
The TD Sequential indicator, a tool typically reserved for long-term cycle analysis, has printed a sell signal on the bi-monthly chart. Historically, the previous two instances of this signal on this timeframe resulted in market corrections of 78% and 32%, respectively. This recurrence places renewed focus on the possibility that Bitcoin may be entering a cooling-off phase, similar to what was observed in 2021–2022.
Weekly SuperTrend Indicator Turns Bearish
One of the most widely respected trend-following indicators, the SuperTrend, has now flipped to a bearish signal on the weekly timeframe. In the past decade, every bearish crossover of the SuperTrend indicator has been followed by a sharp unwinding in price, suggesting that market momentum may have shifted away from buyers for the time being.
Breakdown Below the 50-Week Simple Moving Average
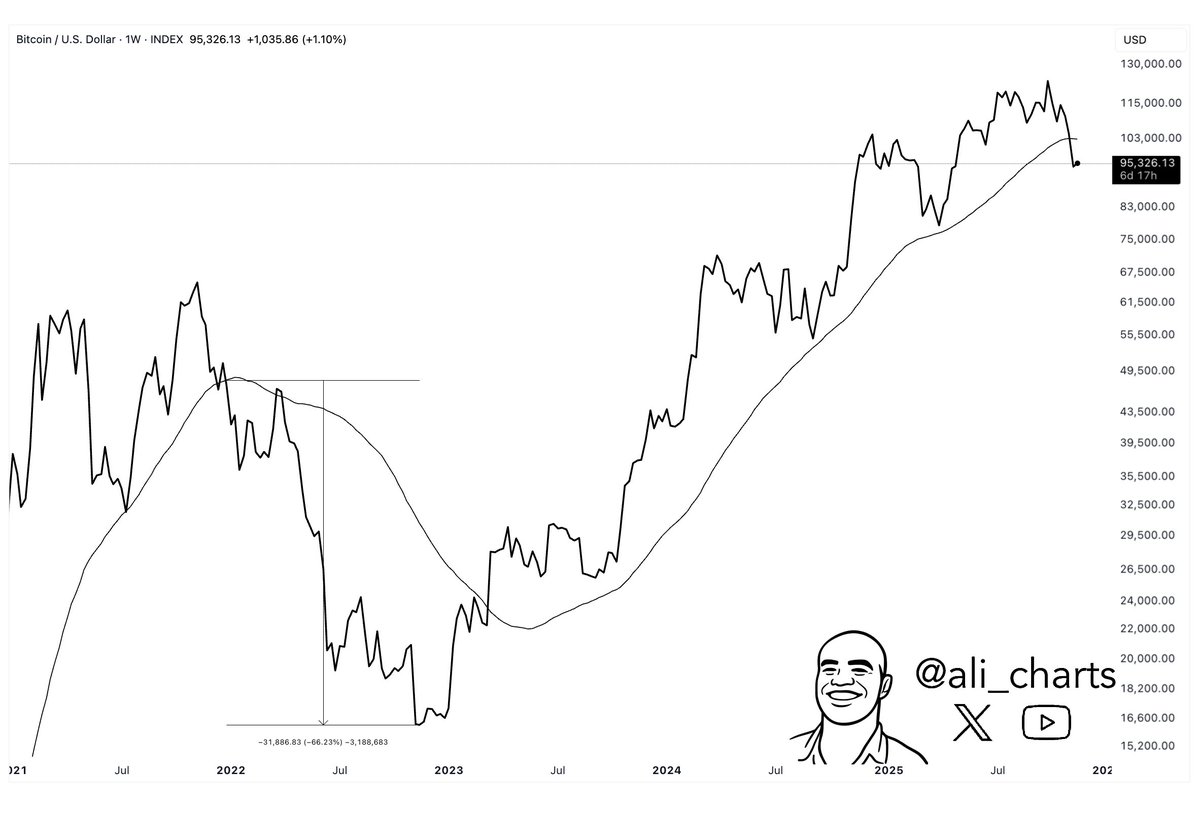
Bitcoin has also fallen below its 50-week simple moving average (SMA), a level that has historically served as a critical "health check" for market cycles. The previous instance of Bitcoin breaking down from this level led to a significant 66% decline. This historical precedent heightens concerns that the market could repeat a similar trajectory if this support level fails to be reclaimed.
Daily Death Cross and Bearish Monthly MACD
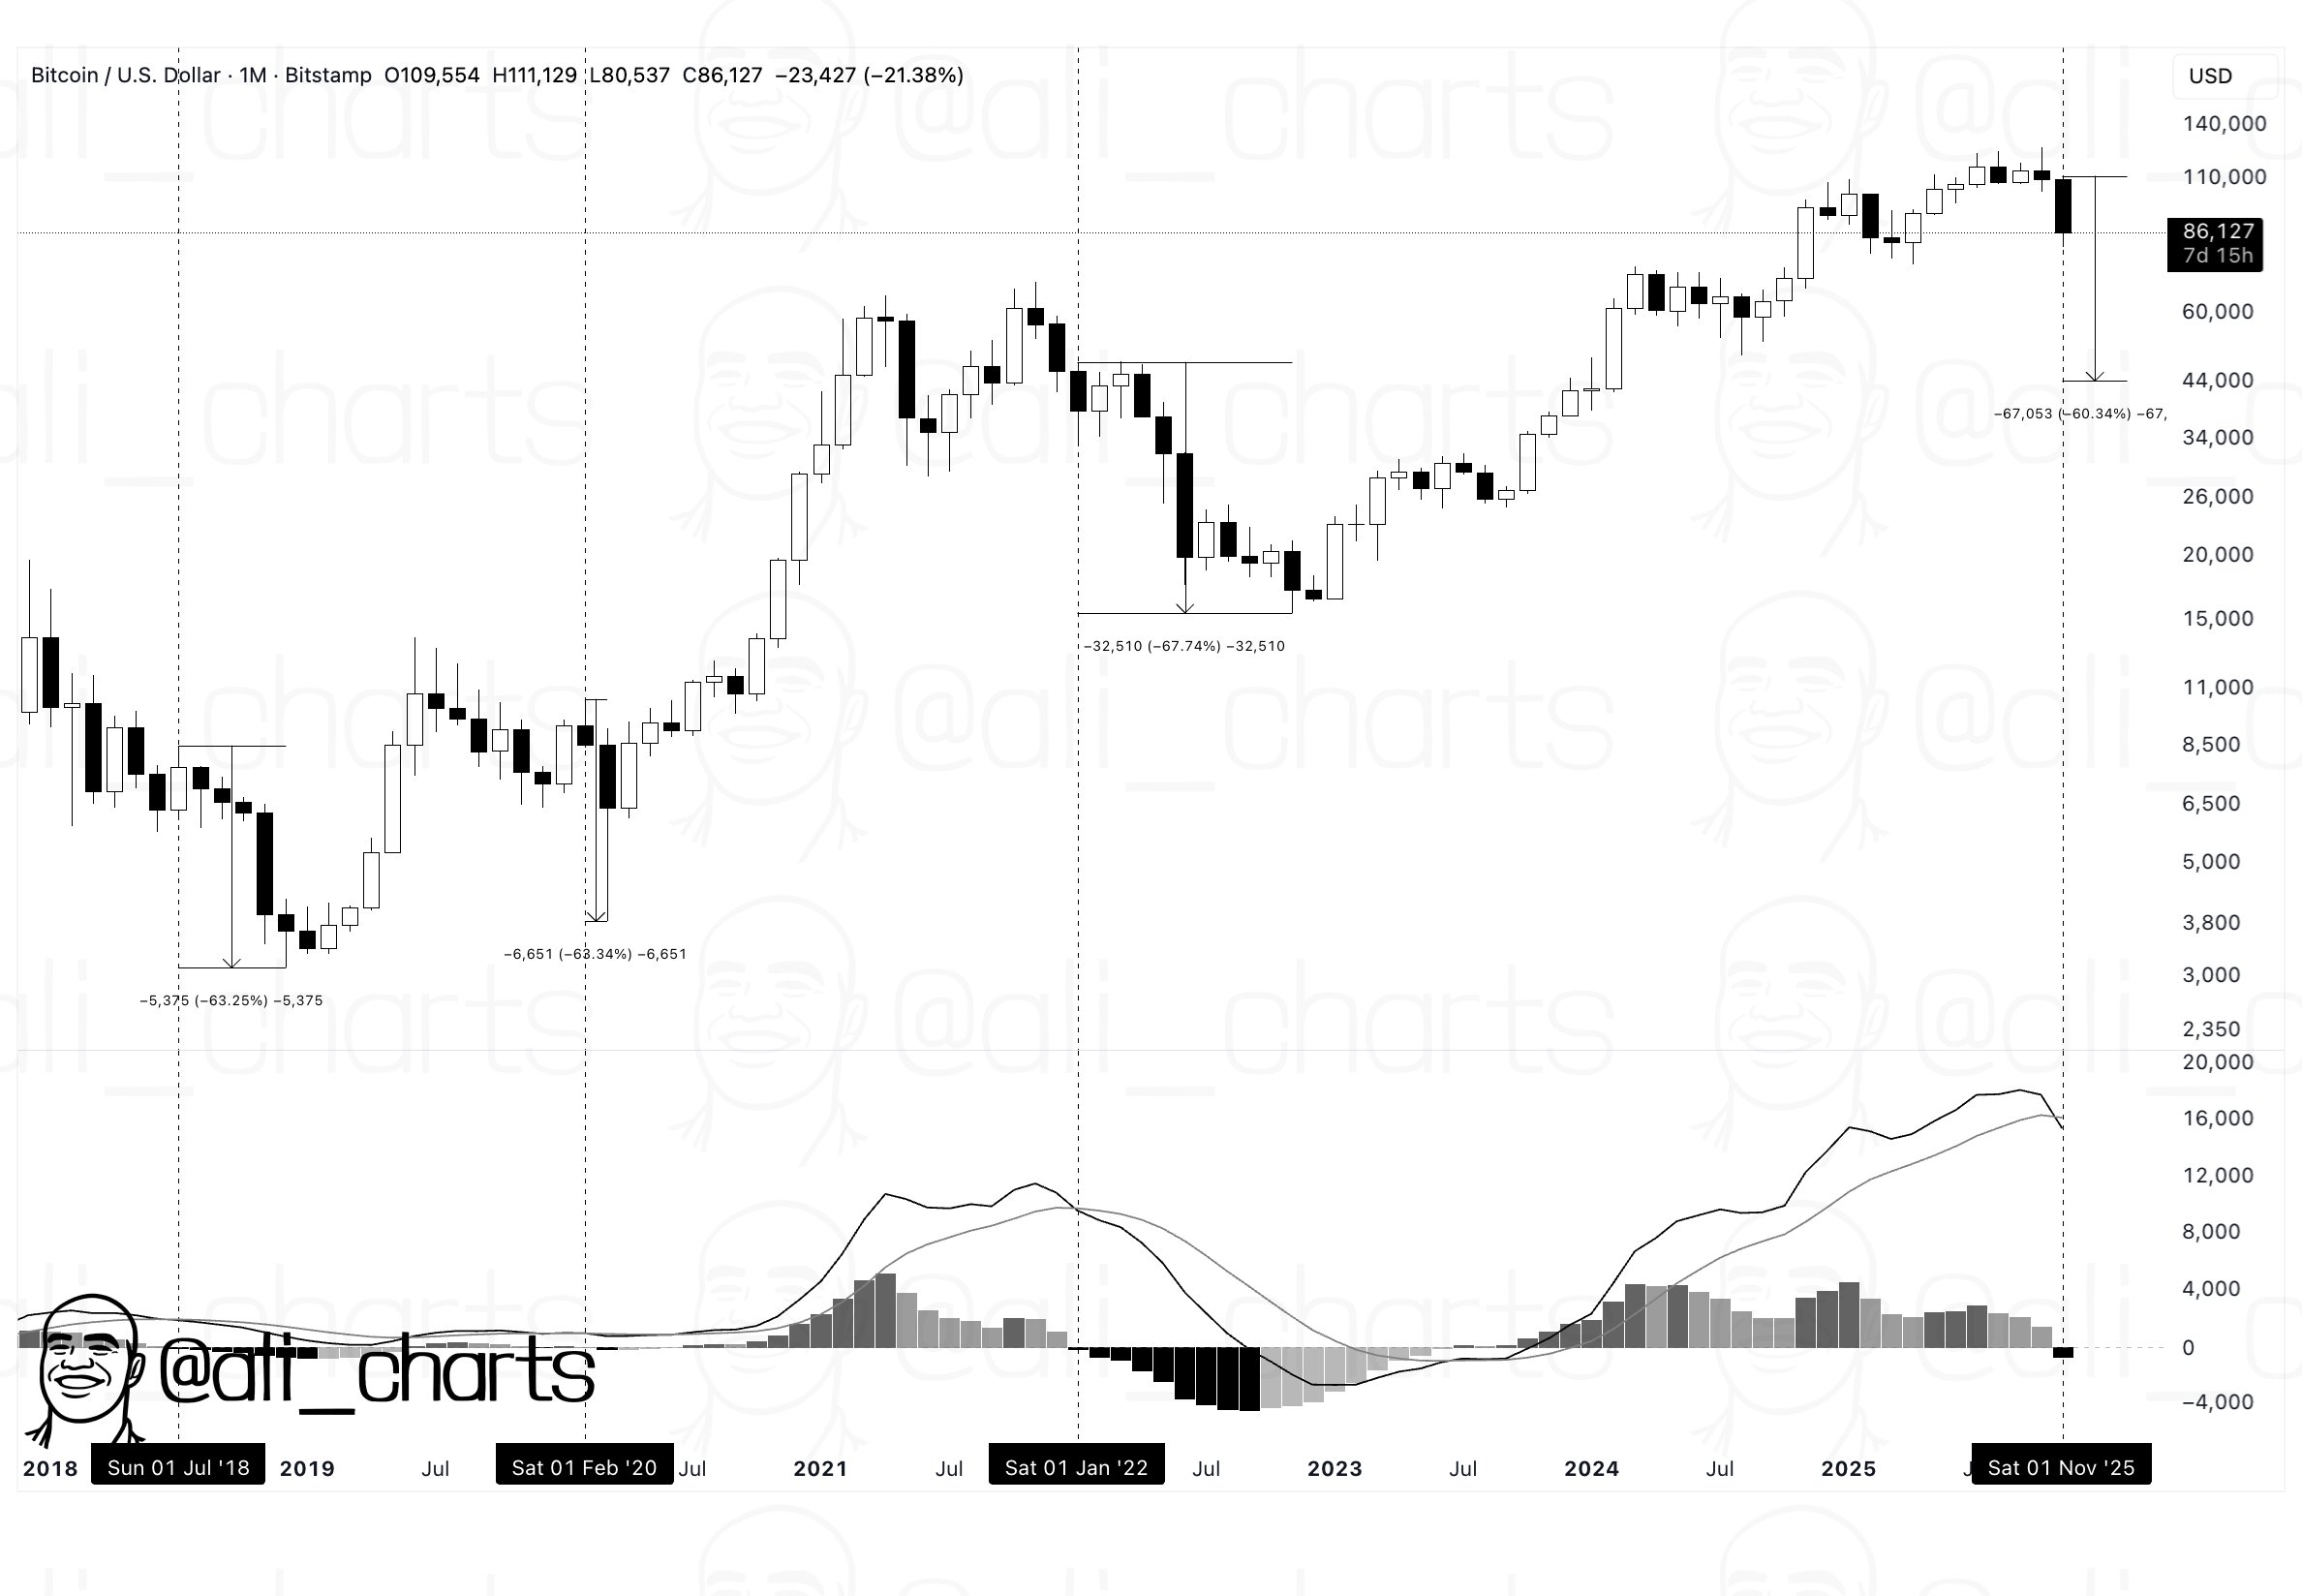
On shorter timeframes, Bitcoin has experienced a "death cross" on the daily chart, where the 50-day SMA has crossed below the 200-day SMA. Concurrently, the monthly Moving Average Convergence Divergence (MACD) indicator has turned bearish for the first time since January 2022. The last three bearish MACD flips on the monthly chart were followed by average declines of approximately 60%. If history repeats, this could indicate potential downside reaching near the $40,000 level.
Assessing the Risk of a Bear Market
The convergence of these five signals does not automatically guarantee a full market reversal into a bear market. However, the unusual alignment of both long-term and short-term indicators has significantly amplified the perceived risk. Analysts emphasize that reclaiming key moving averages and invalidating the current bearish crossovers will be crucial steps in preventing the ongoing pullback from evolving into a more structural downturn.
For the time being, traders are closely monitoring the $75,740 level as the next significant line of defense. A successful hold at this price point could reinforce the narrative of a healthy cycle correction. Conversely, a decisive breakdown below this level could leave the market vulnerable to deeper retracements, potentially into the mid-$50,000 range.