

Sui has experienced a challenging period recently, with its price consistently declining and the broader market appearing to lose interest. However, a significant shift occurred when the SUI price reached a critical support area near the lower boundary of its range. This level triggered buyer interest, leading to a price rebound from its lows.
This recovery is not overtly dramatic or attention-grabbing; it is a subtle bounce. Such quiet recoveries often have the potential to develop into more substantial upward movements if key resistance levels are successfully breached.
Market analysts have noted that SUI is currently situated in a crucial reaction zone. If the price can ascend back above the indicated dotted resistance levels, the momentum of this move could accelerate significantly.
Traders are observing the SUI chart with renewed attention, as the current technical setup suggests readiness for a notable price increase.
The Larger Structure Suggests a SUI Breakout is Likely
Examining the daily chart provides a broader perspective, revealing a recurring pattern in SUI's price action over several months. This pattern typically involves a significant sell-off forming a falling wedge, followed by a price rebound, and ultimately a breakout with strong upward momentum.
This sequence was observed in the spring and again in the summer. The current market conditions present a similar setup for the third time.
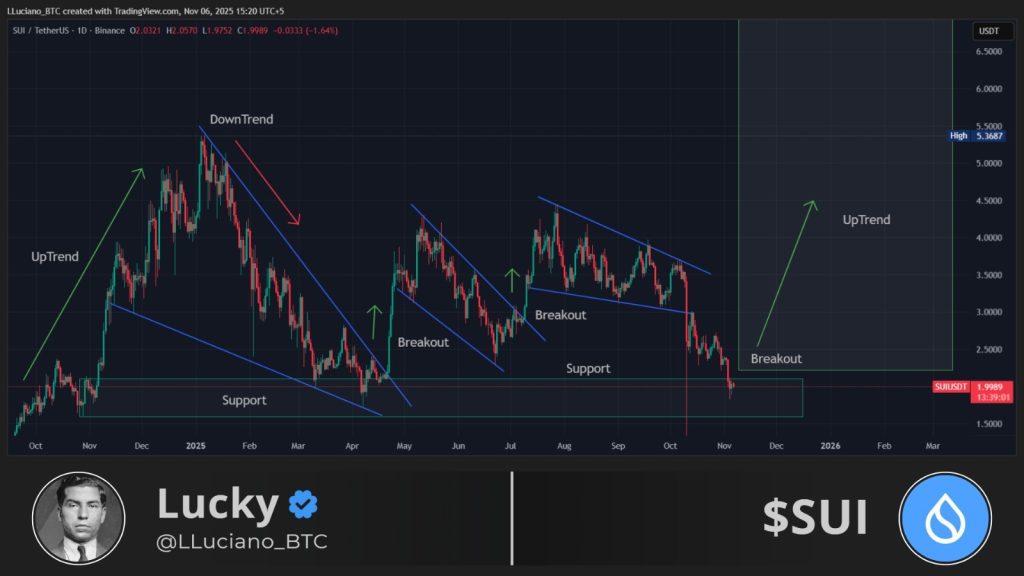
The support area has held firm once more, positioning the SUI price just below the trend line that historically precedes a rally. If past performance is indicative of future results, this juncture could mark a transition from a bearish to a bullish market sentiment.
Key SUI Price Level Under Scrutiny
On the short-term chart analysis, a critical barrier for SUI is identified around the $2.12 mark. This was the price point where SUI encountered resistance during its initial rebound attempt, and it continues to act as a current impediment for buyers.
A successful push by bulls through this level, converting it into support, would immediately signal a shift in the SUI chart towards breakout territory.
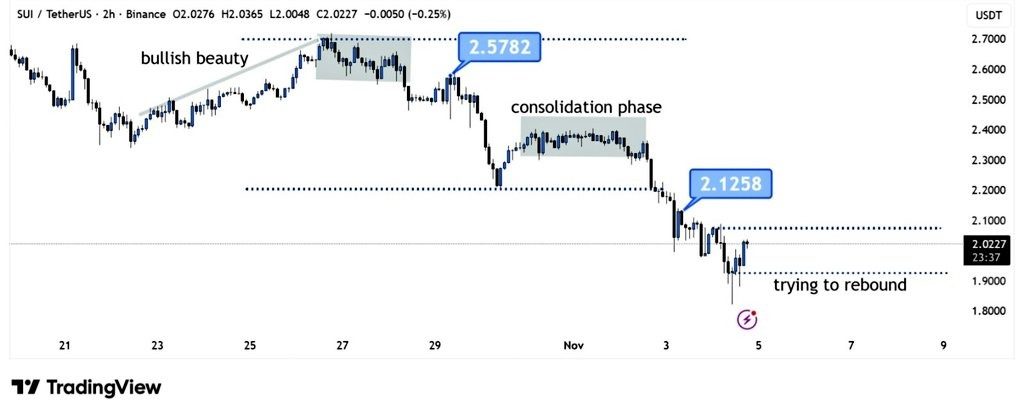
Following a breakout above $2.12, traders will likely focus on the $2.57 region, which was the starting point of the previous consolidation phase. Surmounting this level would solidify the trend reversal for a broader audience of market participants.
The current market situation presents clear price levels for SUI. The outcome hinges on whether SUI can break through resistance, driving momentum, or if it will remain within its current range for an extended period.
Potential for a Significant SUI Comeback
Should SUI successfully break through the overhead resistance, the subsequent price movement could potentially surprise those who believe the recent sell-off has ended its upward trend. A robust surge could easily reintroduce the mid-$3 levels. If market sentiment becomes more enthusiastic, the $4 area could emerge as the next significant target zone.
This is precisely what makes the current setup so compelling. While the bounce is not yet a prominent feature, every major rally originates from a point that mirrors this situation: a subtle shift from weakness to strength that initially goes unnoticed by many.
Could This Be the Turning Point for SUI?
Sui's current market position is far from unfavorable. The support level has held precisely as anticipated, buyers are entering the market at an opportune moment, and the resistance is within close proximity, suggesting that a single strong move could invigorate the entire market.
If the SUI price successfully surpasses the $2.12 resistance, the next significant test will be at $2.57. Beyond that point, the market narrative will undergo a substantial transformation. Instead of questioning the sustainability of the rebound, discussions will shift to the potential magnitude of the rally.