
Kaspa price remains under pressure as price trades just above $0.087, sitting directly on trendline and 200-day SMA support.
Momentum has weakened since the July peak near $0.12, and technical indicators lean bearish, though one short-term signal points to a possible bounce.
Let’s take a closer look at today’s setup.
 What We Got Right Yesterday
In yesterday’s prediction, we pointed out the importance of the $0.084-$0.088 zone, calling it the battleground for bulls and bears.
Kaspa price tested this area again, holding above it and closing near $0.0878, showing that the trendline remains intact for now.
We also noted that unless $0.092 resistance was cleared, sideways chop between $0.087 and $0.092 was likely. That scenario played out, with price staying locked inside this narrow band without breakout confirmation.
 Kaspa Daily Overview (August 21)
Kaspa price is holding above its rising trendline from late June, but price remains capped under $0.092 resistance. Buyers continue to defend the confluence support, yet upside progress has stalled.
 What the Kaspa Chart Is Showing
The KAS chart shows a compression pattern formed by higher lows against strong resistance between $0.090 and $0.095.
Each pullback has long wicks near support, reflecting dip buying interest, but candles stay small-bodied, reflecting hesitation and overhead supply.
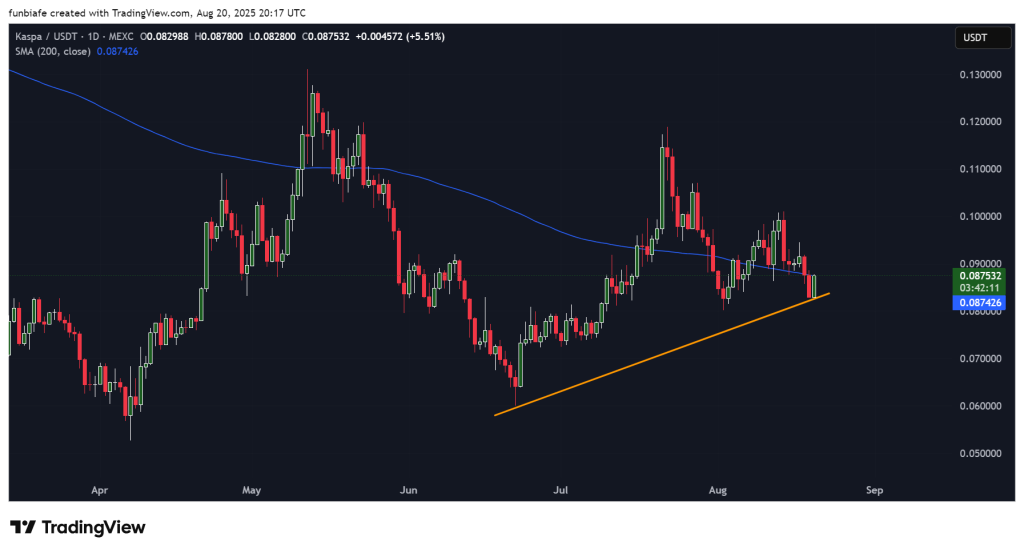 Source: TradingView
If $0.092 breaks, KAS price can test $0.095-$0.098, with higher targets at $0.102-$0.105. On the downside, a strong close below $0.084 would expose $0.080, with lower support at $0.076-$0.077.
 Technical Indicators (Daily Timeframe)
| Indicator | Value | Signal |
| MACD (12,26) | -0.001 | Bearish momentum, sell signal |
| ADX (14) | 18.46 | Weak trend strength, neutral |
| CCI (14) | -126.07 | Oversold, sell signal |
| RSI (14) | 46.86 | Neutral, slightly bearish |
| ROC | 0.015 | Short-term upward momentum, buy signal |
| Bull/Bear Power (13) | -0.0093 | Bears slightly stronger |
Summary: Most indicators lean bearish, with MACD, CCI, and Bull/Bear Power showing weakness. RSI and ADX point to indecision, while ROC hints at a short-term bounce attempt.
 Kaspa Price Prediction Scenarios
Bullish Scenario:
A breakout above $0.092 with volume could open the path toward $0.095-$0.10. Clearing $0.10 would target $0.11-$0.115.
Neutral Scenario:
If $0.084 support holds, expect sideways action between $0.087 and $0.092 until a stronger move develops.
Bearish Scenario:
A close below $0.084 could trigger a drop to $0.080. Failure to hold there may send KAS price toward $0.075.
 Wrapping Up
Kaspa price is stuck at a key confluence support and traders are waiting for resolution from the $0.086-$0.092 zone. Indicators are bearish-biased but positive ROC indicates near-term buyers remain active.
Most likely for the time being is more sideways movement between $0.087 and $0.092 until bulls overcome resistance or sellers break $0.084 support.
Read Also: Kaspa Reaches Record High in Google Searches: How Far Can KAS Price Run This Cycle?
Subscribe to our YouTube channel for daily crypto updates, market insights, and expert analysis.
The post Kaspa (KAS) Price Prediction for Today, August 21 appeared first on CaptainAltcoin.
By Captain Altcoin
about 4 hours ago
